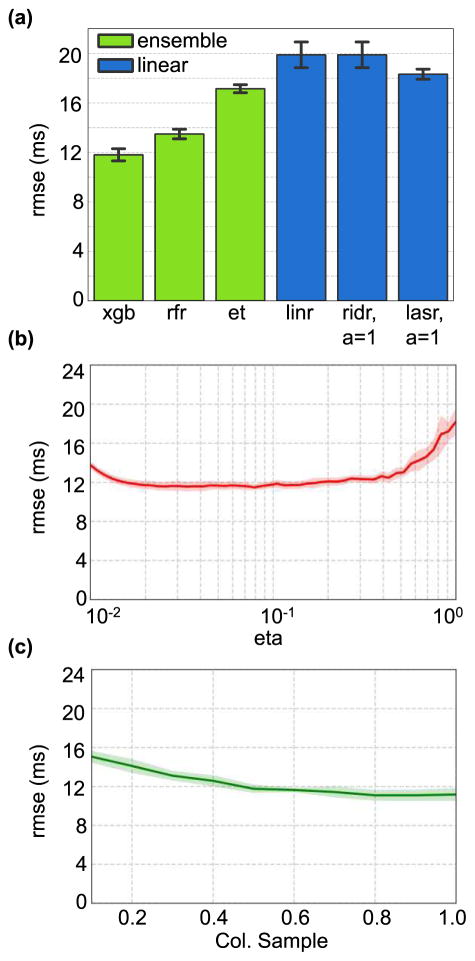
Fig. 5.
(a). Comparing RMSE for PEP estimates obtained using ensemble regression models vs. linear regression models on features obtained from SCG signals that performed best with XGBoost (i.e., LC+sternum z-axis). (b) RMSE for PEP estimates obtained using XGBoost on features obtained from LC+sternum z-axis while varying the learning rate parameter (c) RMSE for PEP estimates obtained using XGBoost on features obtained from LC+sternum z-axis while varying the column sample parameter. The shaded regions in parts (b) and (c) indicate the standard deviation since the cross-validation is repeated 50 times.

