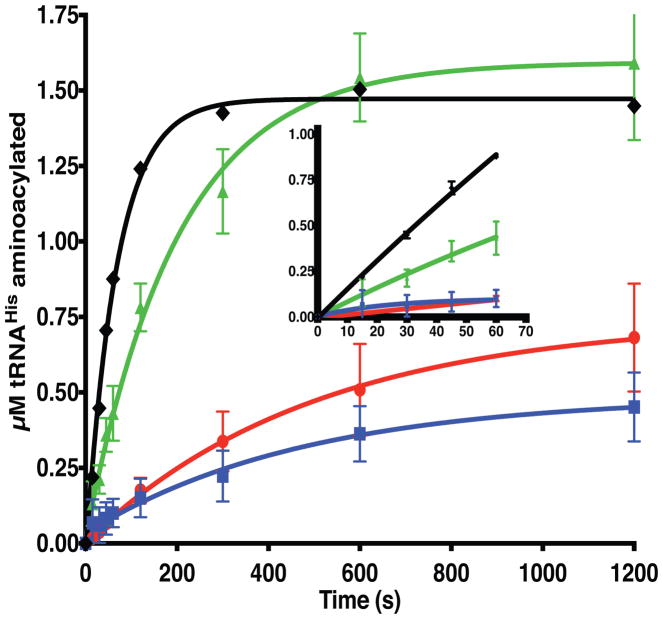
Figure 5. Neuropathy-associated HARS mutations reduce aminoacylation function.
Progress curves for aminoacylation of tRNAHis substrates with histidine by wild type or mutant HARS enzymes under conditions of excess substrates and limiting enzyme. Reaction conditions utilized saturating substrates (10 mM ATP, 10 mM histidine, and 10 μM tRNAHis) with either wild type or mutant HARS enzymes. The progress of the reaction was followed by detection of aminoacylated 32P radiolabeled over time, as described in “Materials and Methods.” The progress curves are color coded as follows: wild-type HARS (black diamonds, ◆); p.Val155Gly HARS (green triangles, ▲); p.Tyr330Cys HARS (red circles, ●), and p.Ser356Asn HARS (blue squares, ■). Each point represents the mean of three independent experiments, and error bars indicate the standard error. Inset, progress curves over the first sixty seconds.

