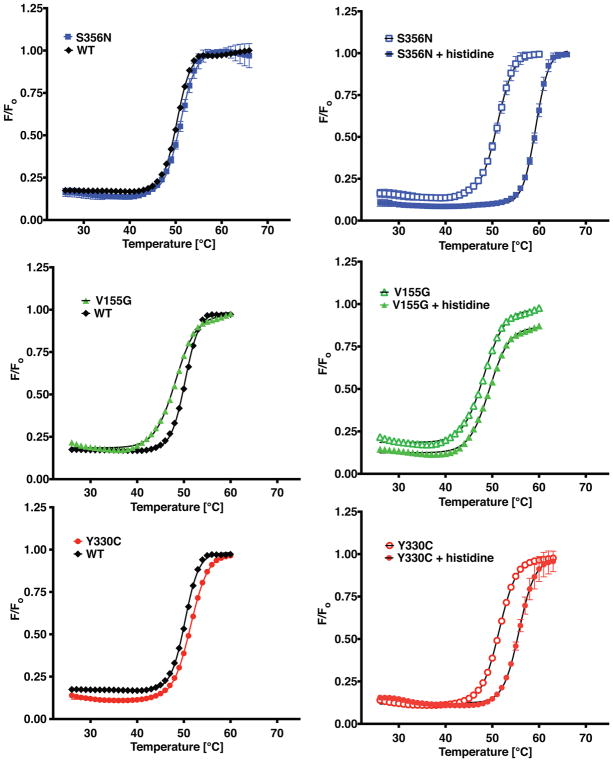
Figure 7. Differential scanning fluorimetry of neuropathy associated HARS enzymes and their interactions with substrates.
A–C, Melting temperature of apo wild type or mutant HARS enzymes determined at a concentration of 10 mM WT enzyme (black diamonds, ◆); p.Ser356Asn HARS (blue squares, ■); p.Val155Gly (green triangles, ▲); and p.Tyr330Cys HARS (red circles, ●). D–F, Stabilization by histidine was investigated by incubation of mutant HARS enzymes with 5 mM histidine. Empty symbols represent apo enzymes, while filled symbols represent histidine bound complexes of p.Ser356Asn HARS (D); p.Val155Gly HARS (E); and p.Tyr330Cys HARS (F). Thermal shift curves are representations of neuropathy-associated mutants measured in duplicate.

