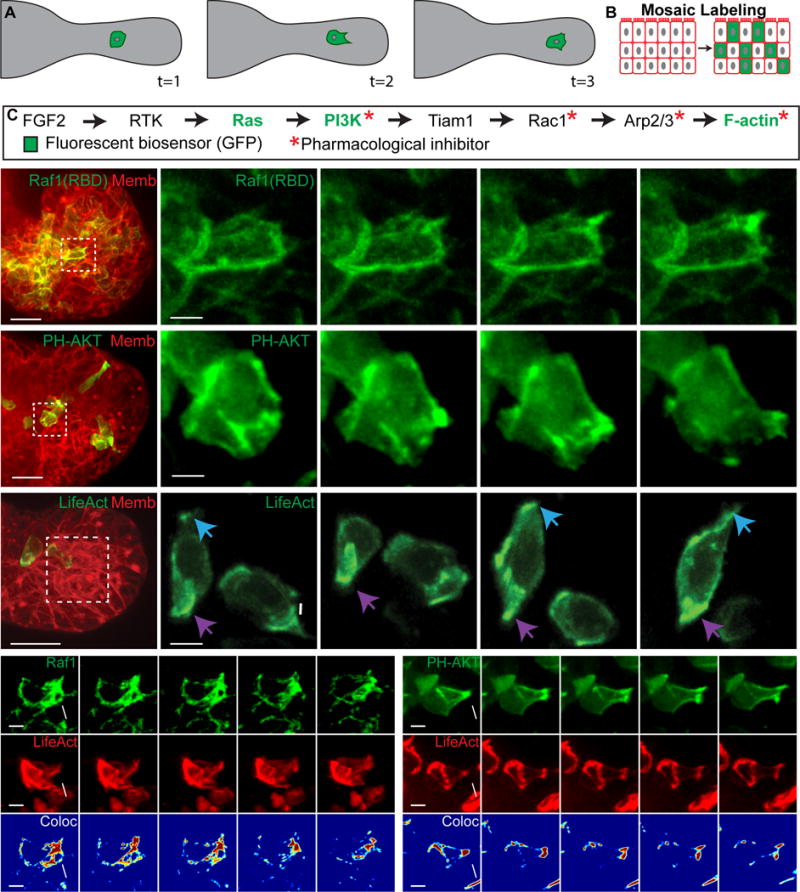
Figure 1. Migratory epithelial protrusions enrich Ras activity, PI3K activity, and F-actin polymerization.

(A) Schematic of cell migration within an organoid branch.
(B) Organoids are labeled mosaically with GFP biosensors.
(C) Receptor tyrosine kinase pathway indicating biosensors and inhibitors used.
(D–H) 3D confocal projections of cells migrating within organoid branches (0.137 μm Gaussian blur, all channels).
(D) A migratory cell enriches Ras activity to a new protrusion (white arrow) (Raf1(RBD)-GFP, green; membrane, red). N=210 cells,16 orgs, r=3. Scale, 20 μm (5 μm inset).
(E) A migratory cell enriches PI3K activity to a new protrusion (PH-Akt-GFP, green; membrane, red). N=150 cells, 10 orgs, r=3. Scale, 20 μm (5 μm inset).
(F) Migratory cells enrich F-actin to new protrusions (white and blue arrows) and display posterior enrichment of F-actin (purple arrows) (LifeAct-GFP, green; membrane, red). N=176 cells from 73 orgs, r=4. Scale, 20 μm (5 μm inset).
(G) A migratory cell enriches (H) Ras activity and (H′) F-actin within a protrusion (Raf1(RBD)-GFP, green; LifeAct-RFP, red). (H″) Colocalization channel of Raf1(RBD) and LifeAct (Jet look up table). N=74 cells, 19 orgs, r=3. Scale, 5 μm.
(H) An intercalating cell enriches (G) PIP3 and (G′) F-actin within a protrusion (PH-Akt-GFP, green; LifeAct-RFP, red). (G″) Colocalization channel of PH-Akt and LifeAct (Jet look up table). N=10 cells, 25 orgs, r=3. Scale, 5 μm. See also Movie S1.
