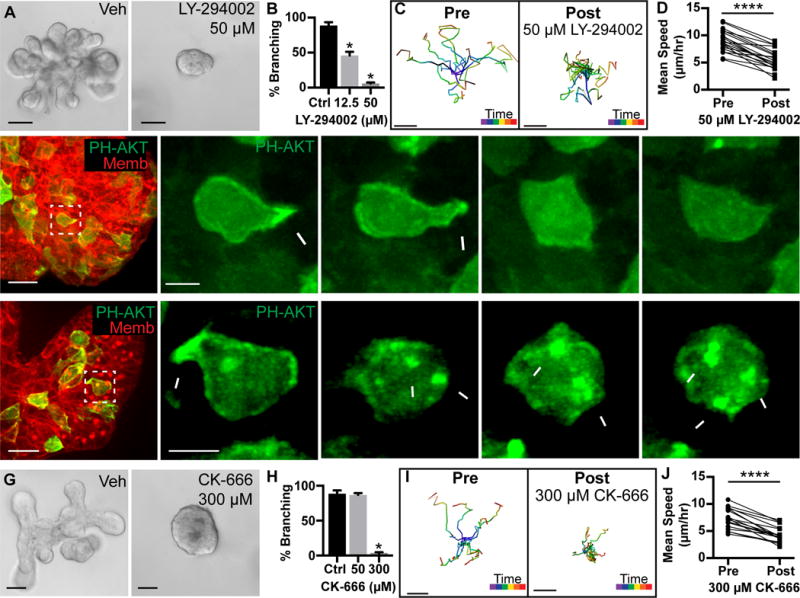
Figure 2. Branching morphogenesis and protrusions require PI3K activity and actin polymerization.

(A) Organoids treated with vehicle or 50 μM PI3K inhibitor (LY-294002) from Day 0. Scale, 50 μm.
(B) Quantification of branched organoids treated at Day 0 with vehicle (87.1±2.5%, 403 orgs), 12.5 μM LY-294002 (46.1±5.2%, 530 orgs), and 50 μM LY-294002 (6.1±1.3%, 514 orgs) (r=4; mean ± SD). Mann-Whitney test, p<0.05.
(C) Tracks of cell migration pre-and post-treatment with 50 μM LY-294002. Scale, 10 μm. Track color codes time (purple, start; red, end).
(D) Quantification of paired mean cell speed (μm/hour) pre-and post-treatment with 50 μM LY-294002. N=20 cells, 3 orgs, r=3. Wilcoxon matched-pairs test, p<0.0001.
(E–F) 3D confocal projections of cell migration (0.137 μm Gaussian blur, all channels).
(E) A migratory cell enriches PIP3 and generates a protrusion (white arrowhead; PH-Akt-GFP, green; membrane, red). PI3K inhibition (50 μM LY-294002) resulted in loss of PIP3 biosensor from the membrane. N=696 cells, 44 orgs, r=3. Scale, 20 μm (5 μm inset).
(F) A migratory cell enriches PIP3 and generates a protrusion (white arrowhead; PH-Akt-GFP, green). Jasplakinolide, Latrunculin A, and Y27632 (JLY) treatment induced retraction of protrusions and cell rounding. Dynamic membrane enrichment of PIP3 continued (white arrows), but did not lead to protrusions. N>1,000 cells, 65 orgs, r=4. Scale, 20 μm (5 μm inset). See also Movie S2.
(G) Organoids were treated with vehicle or 300 μM Arp2/3 inhibitor (CK-666) from Day 0. Scale, 50 μm.
(H) Quantification of percent branching in organoids treated from Day 0 with vehicle (88.7±4.8%, 403 orgs), 50 μM CK-666 (87.1±2.5%, 522 orgs), or 300 μM CK-666 (2.9±1.9%, 425 orgs) (r=4; mean ± SD). Mann-Whitney test, p<0.05.
(I) Tracks of cell migration pre-and post-treatment with 300 μM CK-666. Scale, 10 μm. Track color codes time (purple, start; red, end).
(J) Quantification of paired mean cell speed (μm/hour) pre-and post-treatment with 300 μM CK-666. N=18 cells, 10 orgs, r=3. Wilcoxon matched-pairs test, p<0.0001.
