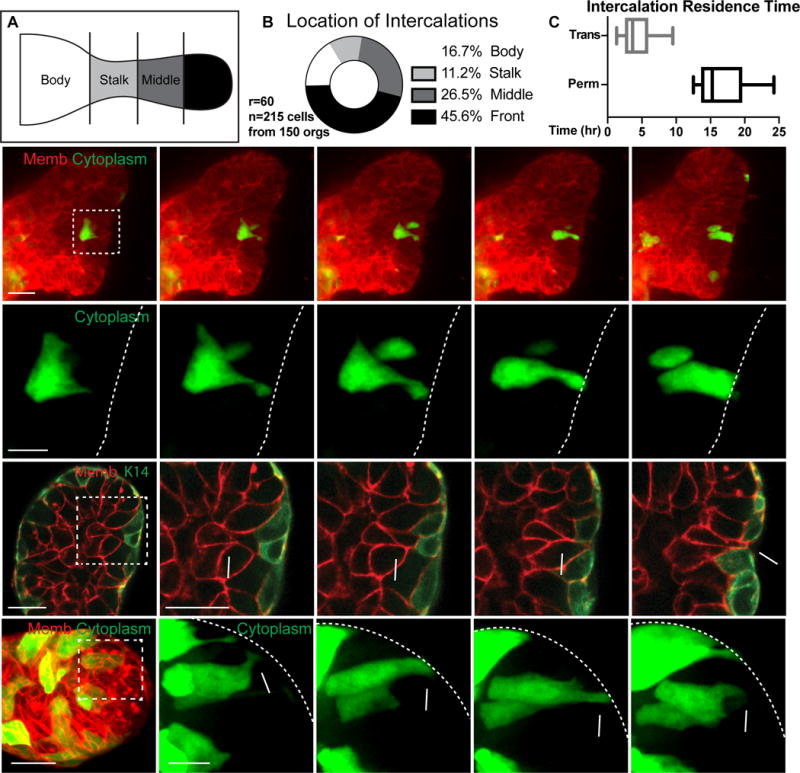
Figure 4. Radial intercalation occurs during duct elongation.

(A) Branches were divided into body, stalk, middle, and front regions.
(B) Intercalations were quantified within body (36, 16.7%), stalk (24, 11.2%), middle (57, 26.5%) or front (98, 45.6%) regions. (215 cells, 150 orgs, r=60). A lower boundary of the rate of permanent intercalations was calculated to be 0.078 per hour (n=39, r=3). This rate is expected to be an undercount due to the stochastic mosaic nature of the labeling.
(C) Basal residence time for intercalations (hours; box and whiskers, Q1::Median::Q3), showing permanent (13.6::15.3::19.7hr, N=13 cells from 11 orgs, r=6) and transient (2.5::3.7::5.9hr, N=16 cells, 12 orgs, r=5).
(D) (D′) 3D confocal projections of a cell migrating, intercalating, and transitioning to columnar morphology (membrane, tdTomato, red; cytoplasm, GFP, green). Scale, 20 μm (10 μm inset). See also Movie S3.
(E) A single plane showing a luminal cell (star) intercalating to contact the myoepithelium (membrane, tdTomato, red; myoepithelium, K14-actin-GFP, green). Scale, 20 μm (10 μm inset).
(F) 3D confocal projections of a transient intercalation, with a cell migrating, intercalating, and exiting the basal surface (membrane, tdTomato, red; cytoplasm, GFP, green). Scale, 20 μm (10 μm inset).
