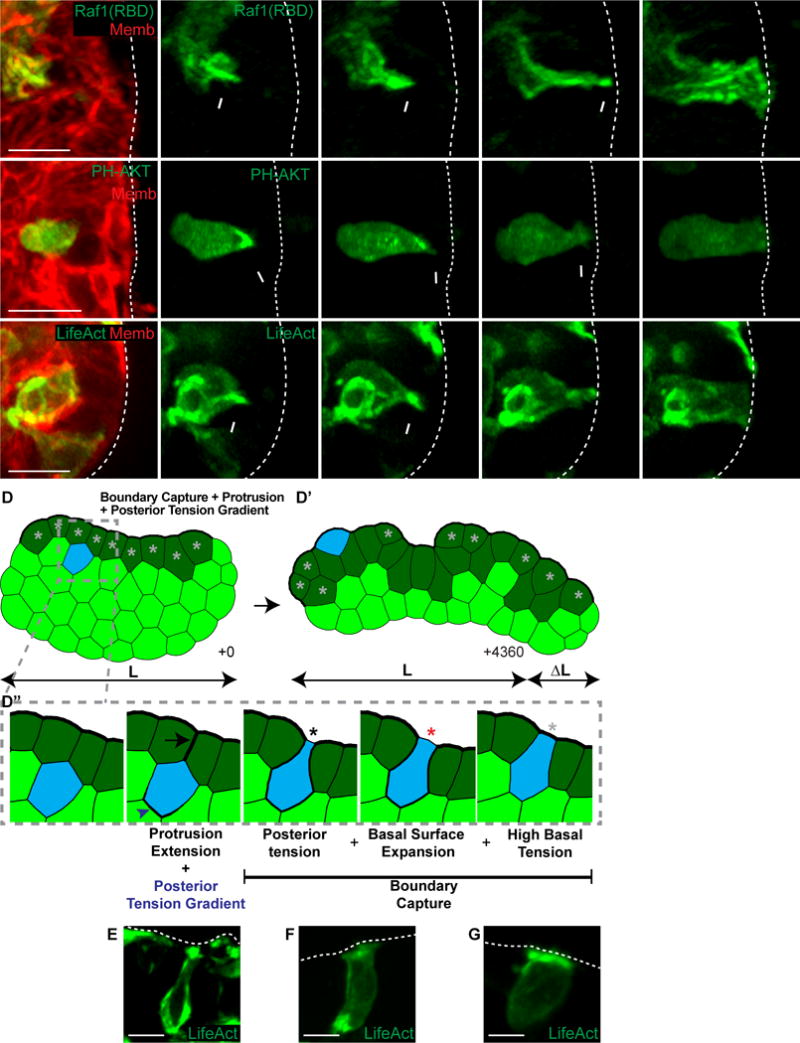
Figure 5. Intercalating epithelium enrich Ras activity, PI3K activity, and F-actin polymerization in protrusions.

(A–C) 3D confocal projections of intercalation (0.137 μm Gaussian blur, all channels).
(A) An intercalating cell enriches Ras activity to its anterior membranes (Raf1(RBD)-GFP, green; membrane, red). N=10 cells, 28 orgs, r=4. Scale, 10 μm. See also Movie S4.
(B) An intercalating cell enriches PIP3 to its anterior protrusion (PH-Akt-GFP, green; membrane, red). N=30, 131 orgs, r=6. Scale bar=10 μm. See also Movie S5.
(C) An intercalating cell enriches F-actin to its anterior protrusion (LifeAct-GFP, green; membrane, red). N=26, 73 orgs, r=4. Scale, 10 μm. See also Movie S6.
(D) A FEM was generated of a tissue with high basal surface tension (dark green cells) to test candidate intercalation mechanisms. Cells were randomly chosen to intercalate towards the basal surface using high anterior protrusion tension and a posterior tension gradient. (D′) The combined intercalation mechanism was sufficient for elongation. (D″) Intercalating cells generated an anterior protrusion (black arrow) and a posterior tension gradient (blue arrowhead) towards the basal high tension line (+1). Cells were captured at the basal surface through a combination of posterior tension and focal disruption of the high basal tissue tension (+3, black star). The basal surface of the intercalating cell then expanded (+4, red star). Intercalation was made permanent when high basal tension was restored (+12, light gray star). Line width indicates relative tension strength. See also Movie S7.
(E–G) 3D confocal projections of intercalation (LifeAct-GFP, green; 0.137 μm Gaussian blur). Scale, 10 μm.
(E) F-actin anterior enrichments and rear gradients, consistent with (D″) +1.
(F) Loss of anterior F-actin enrichments with high posterior tension, consistent with (D″) +3 and +4.
(G) High basal F-actin enrichment upon intercalation completion, consistent with (D″) +12.
