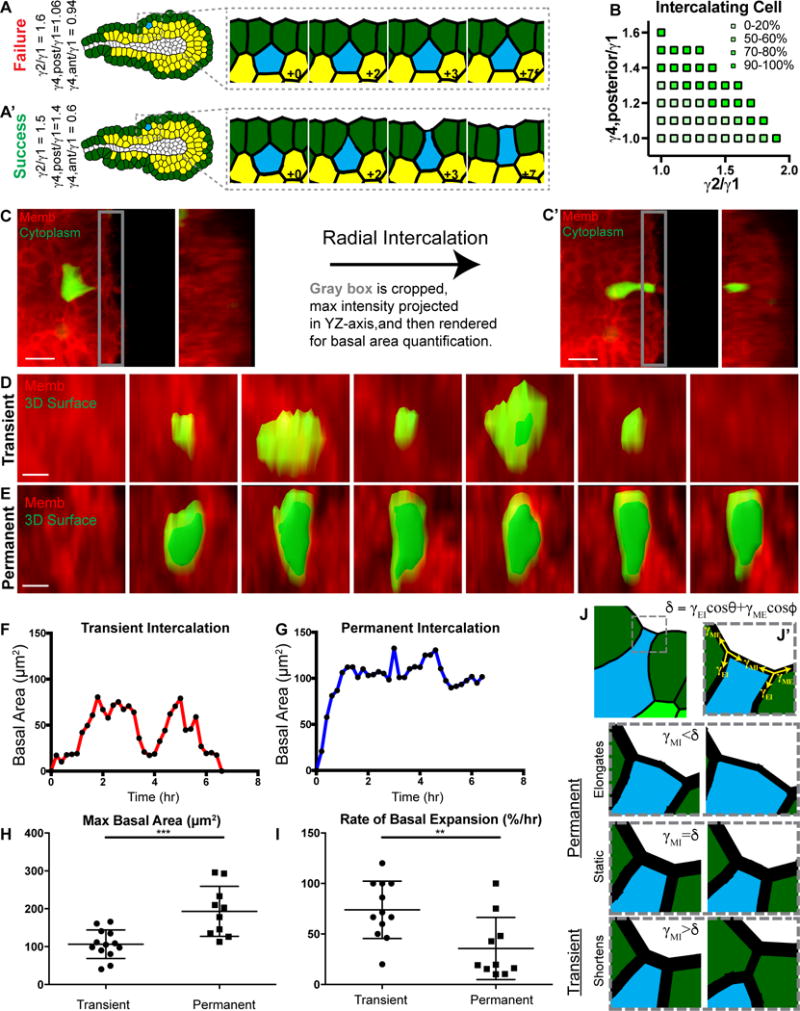
Figure 6. Transient and permanent intercalations are distinguished at the basal tissue surface.

(A) A tissue field was wrapped around a lumen to form a 2D stratified epithelium modeling a 3D mammary end bud. Example of a cell failing to contact the basal surface (blue), with protrusion strength of 1.6× and posterior gradient strength of 1.06× field strength. (A′) Example of a successful intercalation (blue), with protrusion strength of 1.5× and posterior gradient strength of 1.4× field strength.
(B) Protrusion strength and gradient strength were varied across FEM simulations to define the mechanical characteristics of successful boundary contact, within the context of the in silico TEB model from (A). Tension magnitudes are defined as in (Figures 3I–J).
(C) Quantification of basal area dynamics (C) prior to and (C′) after radial intercalation. The YZ maximum intensity projection displays the cell’s basal area in green.
(D) YZ-axis projection showing membrane (tdTomato, red) and 3D surface rendering (green) of basal area during (D) transient and
(E) permanent intercalation.
(F) Quantification of basal area (μm2, from D) during transient and
(G) permanent (μm2, from E) intercalation.
(H) Quantification of the maximum basal area (μm2, mean ± SD) during intercalation for transient (106.5 ± 37.8μm2) and permanent (193.2 ± 66.1μm2). N=22 cells, 19 orgs, r=11. Mann-Whitney test, p<0.001.
(I) Quantification of the rate of basal expansion (%/hour, mean ±S D) during intercalation for transient (73.9 ± 28.4%/hr) and permanent (35.7 ± 30.7%/hr). N=22 cells, 19 orgs, r=11. Mann-Whitney test, p<0.01.
(J) A FEM was generated of a tissue with high basal surface tension (dark green cells) to test candidate mechanisms for basal area of an intercalating cell. A cell (blue) was captured at the basal surface through a combination of posterior cell tension and focal disruption of the high basal tissue tension. (J′) Principle tension components (γMI, γEI, γME, yellow arrows) acting at the two intercellular junctions. M, Matrix; I, Intercalating cell; E, Epithelial cell. Angles θ and ϕ are the angles γEI and γME, respectively, make with the action line of γMI as illustrated in Figure S5D. The intercalated cell basal surface could then undergo 1 of 3 conditions:
(K) γMI<γEIcosθ+γMEcosϕ results in expansion of the basal surface (+0.75), a permanent intercalation.
(L) γMI=γEIcosθ+γMEcosϕ results in stasis of the basal surface (+0.75), a permanent intercalation.
(M) γMI>γEIcosθ+γMEcosϕ results in contraction of the basal surface (+0.75), a transient intercalation.
