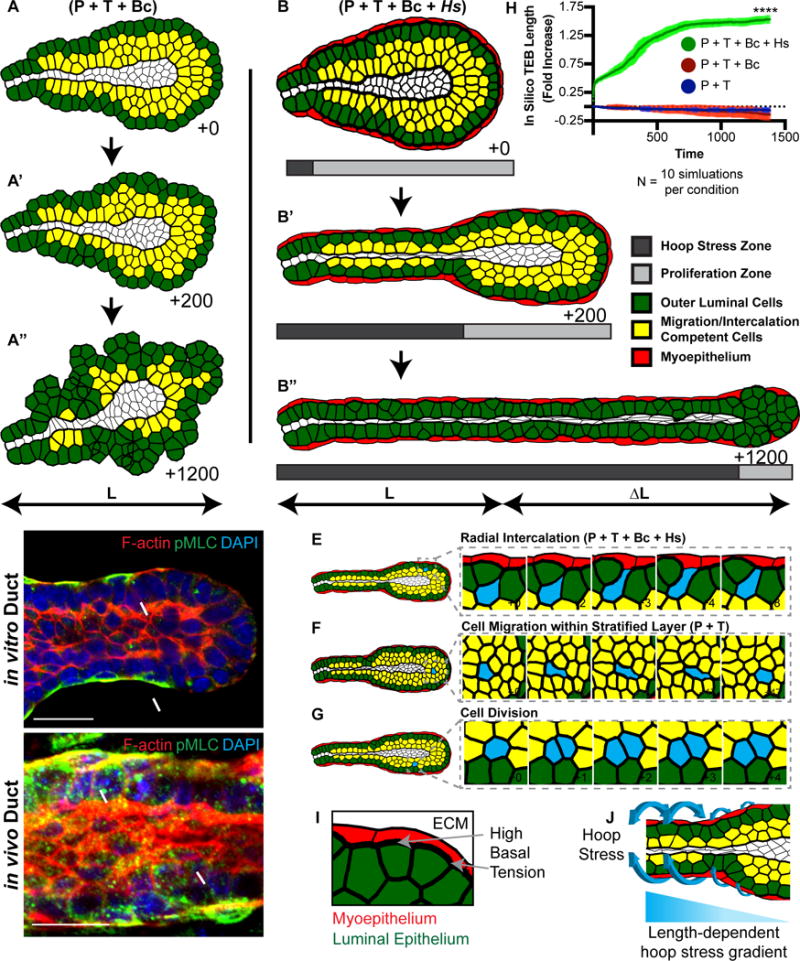
Figure 7. Mammary tubes can elongate using radial intercalation, anterior protrusions, posterior tension gradients, and high basal stress.

(A) A FEM of a terminal end (TEB) testing the combination of anterior protrusion (P), posterior tension gradient (T), and boundary capture mechanism (Bc) driven intercalation. Interior cells could migrate and divide and a subset were randomly chosen to intercalate (yellow), with normally distributed protrusion and tension gradient strengths, directed towards the basal most luminal cell layer (green cells). The lumen does not affect cellular tensions. These mechanisms resulted in disorganized growth and not efficient elongation. See also Movie S8.
(B) The FEM from (A) was extended to include high basal tension and in-plane stress applied towards the organoid center-line (hoop stress), to model the function of the contractile myoepithelium (red). The region in which the hoop stress (dark gray) was applied or cell proliferation (light gray) occurred varied over time (B′ and B″). The combination of anterior protrusions (P), posterior tension gradients (T), boundary capture mechanism (Bc), and high basal hoop stress (Hs) was sufficient to drive efficient elongation. See also Movie S8.
(C) A confocal image of an organoid branch showing F-actin (Phalloidin, red), phosphomyosin light chain (pMLC, green), and nuclei (DAPI, blue). Scale, 20 μm. Representative of 49 orgs, r=3.
(D) A confocal image of an in vivo 8-week old mammary duct showing F-actin (Phalloidin, red), pMLC (green), and nuclei (DAPI, blue). Scale, 20 μm. Representative of 32 ducts, r=4.
(E) An interior cell (blue) intercalating via the mechanisms identified in (B).
(F) An interior cell (blue) migrating in the tissue via the mechanisms identified in (B).
(G) An example of cell proliferation (blue) in the proliferation zone.
(H) Representative results of in silico TEB fold increase from FEM simulations using the following conditions: blue, protrusions + posterior tension gradient; red, protrusions + posterior tension gradient + boundary capture mechanism; and, green, protrusions + posterior tension gradient + boundary capture mechanism + hoop stress. T-test, p<0.0001.
(I) Schematic demonstrating the high basal tension (thick black line, gray arrows) between the two layers of the myoepithelium (red) and luminal epithelium (green).
(J) Schematic demonstrating the circumferential hoop stress applied in 3D (blue arrows). A time-varying length-dependent hoop stress gradient is applied during elongation of the in silico TEB.
