
Figure 1.
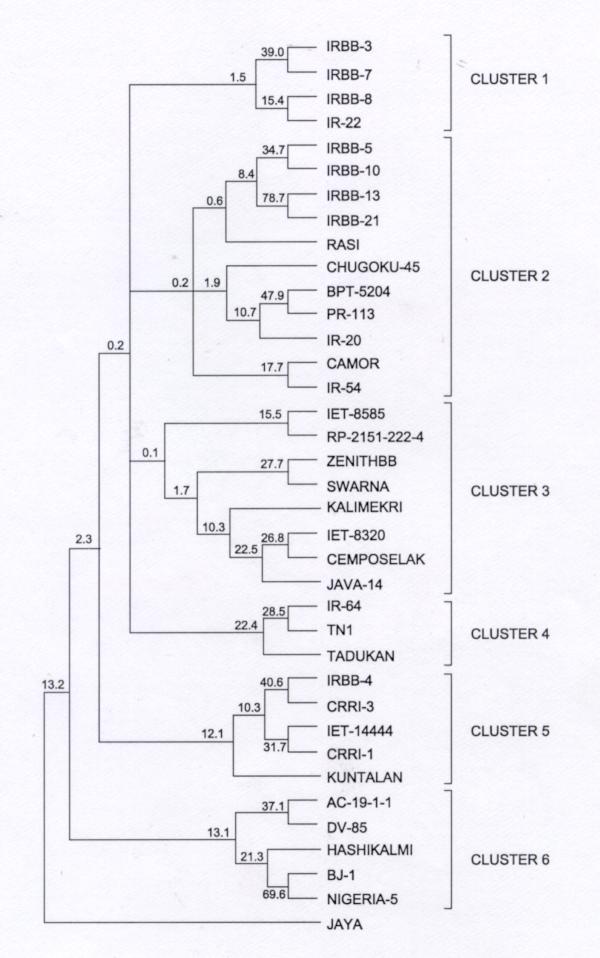
Dendrogram showing the genetic relationships between different near-isogenic lines, bacterial blight resistant and susceptible lines based on the polymorphism data obtained at the three (GATA)n-containing microsatellite loci. The numbers at the forks indicate the confidence limits (bootstrap values) for the grouping of those species, which are to the right of that fork. The numbers on the branches of the tree indicate the percentage of times the genotypes to the right of the branching point were grouped together during bootstrapping analysis.