
Figure 1.
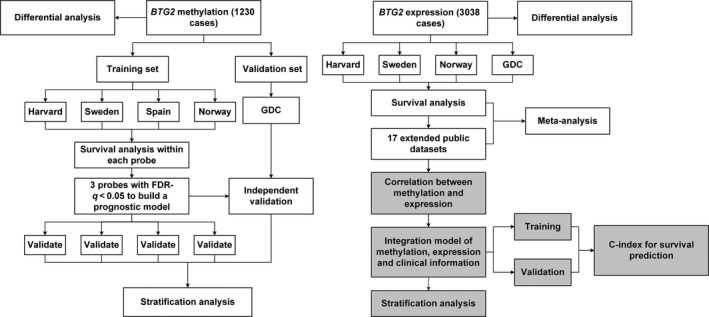
Flow chart indicating study design. The whole study could be divided into three parts. First, we used the methylation data to compare the difference between tumour and normal tissue, build a prognostic model, and validate it in the different cohorts. Secondly, we used the gene expression data to evaluate the BTG2 expression and overall survival by meta‐analysis. Lastly, we performed an integration analysis based on clinical information, methylation and expression data.