
Figure 2.
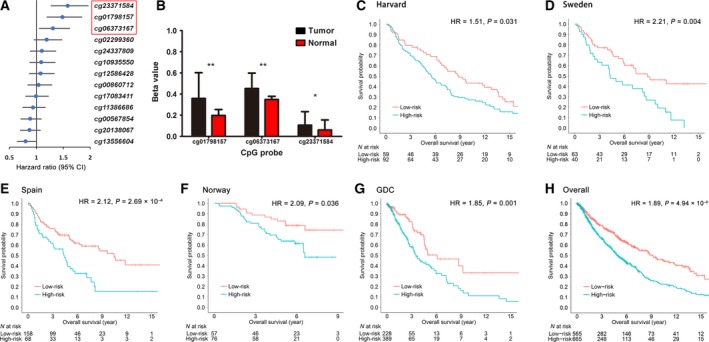
Methylation analysis for BTG2. (A) HR with 95% confidence interval (95% CI) of the 13 CpG sites in Cox regression analysis in the training set. The top three probes were significantly associated with survival. (B) Methylation differential comparison of the three probes between tumour and adjacent normal tissues. Data were described as mean and SD. **FDR‐q < 0.001; *FDR‐q < 0.05. (C–H) Kaplan–Meier survival analyses of the methylation prognostic model, which were categorized into low‐risk and high‐risk groups using a cut‐off value of the median value in the training set for (C) Harvard, (D) Sweden, (E) Spain, (F) Norway, (G) GDC, and (H) overall dataset.