
Figure 1.
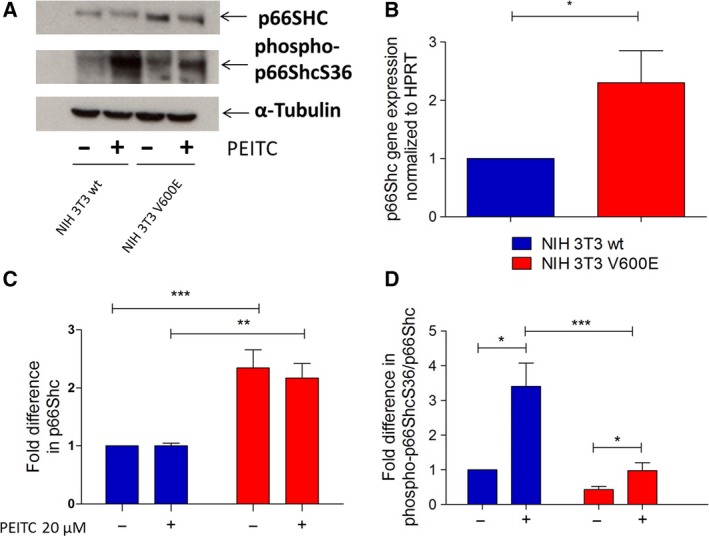
p66Shc status in NIH 3T3 wt and NIH 3T3 V600E‐transformed cells before and after PEITC treatment. A total of 500 000 NIH 3T3 wt and NIH 3T3 V600E cells were seeded in six‐well plates in complete growth medium, and the following day, cells were treated with 20 μm PEITC for 30 min. A representative blot is shown in panel (A). The results of qPCR analysis of p66Shc mRNA expression are summarized in (B). Densitometric analysis of total p66Shc protein relative to α‐tubulin was performed (C). Densitometric analysis of phospho‐p66ShcS36 was performed relative to total p66Shc protein (D). Data are presented as mean value ± standard error of the mean (SEM) of nine independent experiments. *P < 0.1, **P < 0.01, ***P < 0.001.