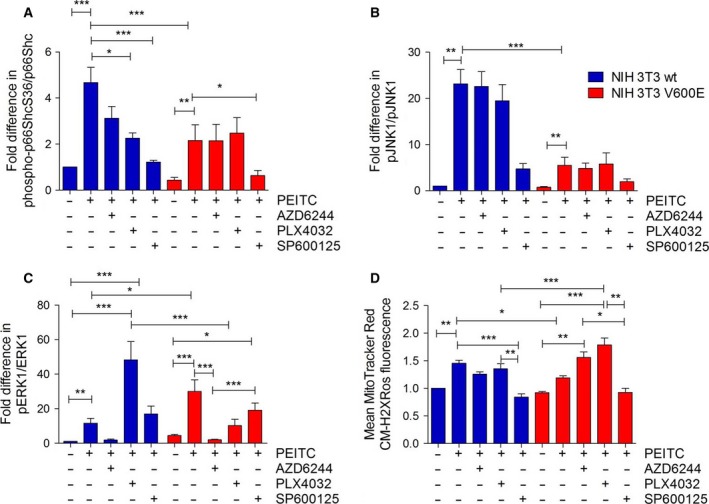
Figure 4.

Effect of MAPK inhibition on p66Shc activation and ROS production. A total of 500 000 cells were seeded in six‐well plates in complete growth medium and treated with 20 μm of AZD6244, PLX4032, or SP600125, 1 h prior to PEITC treatment (30 min, 20 μm) prior to lysis. Immunoblots were carried out for the proteins indicated, and phosphorylation of p66Shc (A), JNK1 (B), or ERK1 (C) was quantified densitometrically. Data are presented as mean value ± standard error of the mean (SEM) of nine independent experiments. (D) ROS production was quantified as described in Fig. 2D. Data are presented as mean value ± standard error of the mean (SEM) of 100 measurements per sample and three experiments. *P < 0.1, **P < 0.01, ***P < 0.001.
