
Figure 8.
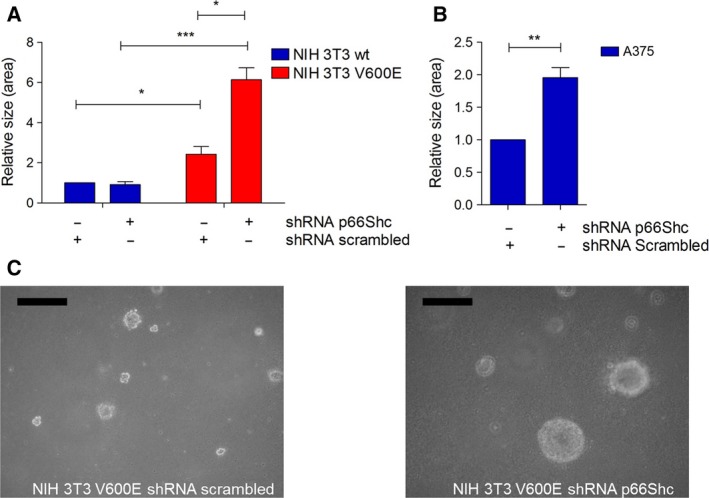
Soft agar growth of NIH 3T3 V600E and A375 cells. Cells were transfected with plasmids expressing shRNA (p66Shc or scrambled) and puromycin resistance. Cells with stable plasmid expression were selected before seeding 10 000 cells in soft agar in six‐well plates in soft agar. After 7 days, the size of the colonies was assessed by measuring the surface area of the colonies using imagej. NIH wt and V600E cells (A) as well as A375 cells (B) were used. NIH 3T3 cells served as control and formed no colonies in soft agar. A representative picture of V600E cells expressing shRNA scrambled (left) or p66Shc (right) is shown in panel (C). Size bar: 500 μm. *P < 0.1, **P < 0.01, ***P < 0.001.