
Figure 1. Ago2 association with GW182 in neuronal dendrites increases in response to NMDAR stimulation.
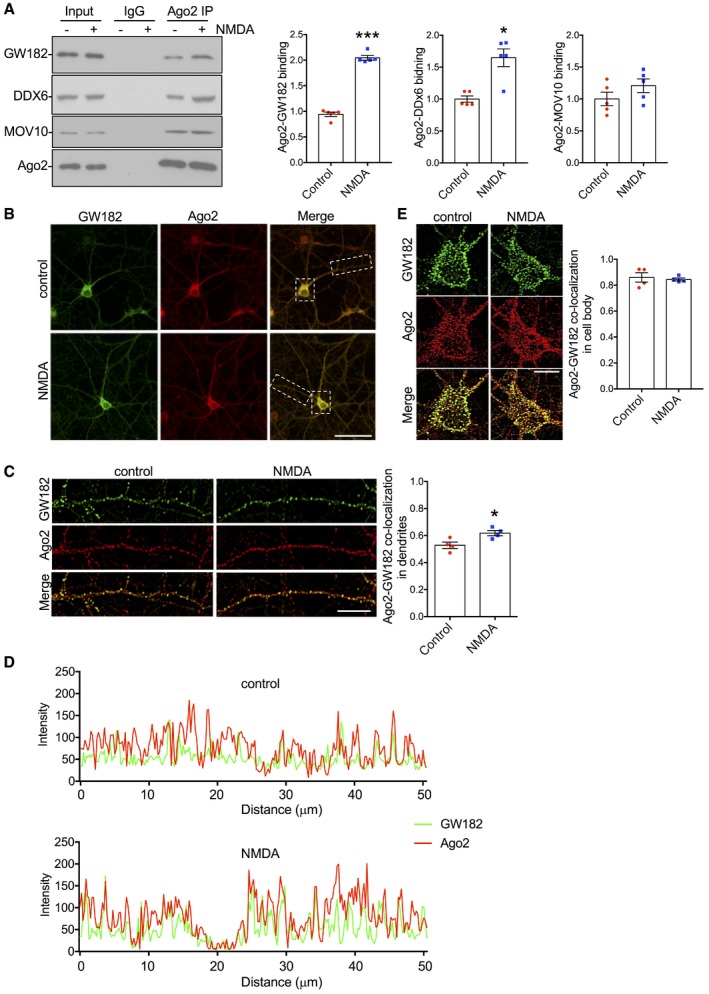
- Endogenous Ago2‐GW182 and Ago2‐DDX6 interactions increase in response to NMDAR stimulation. Cortical neuronal cultures were exposed to NMDA or vehicle for 3 min, and lysates were prepared 10 min after NMDA washout and immunoprecipitated with Ago2 antibodies. Proteins were detected by Western blotting. Graph shows quantification of Ago2‐GW182 interaction, normalised to vehicle control; n = 5. *P < 0.05; ***P < 0.001; t‐test; mean ± SEM.
- Analysis of endogenous Ago2‐GW182 co‐localisation in cortical neuronal cultures. Cortical neuronal cultures were exposed to NMDA or vehicle for 3 min, fixed 10 min after NMDA washout, permeabilised and co‐stained with Ago2 and GW182 antibodies. Representative whole‐cell images are shown. Scale bar = 50 μm.
- Endogenous GW182‐Ago2 co‐localisation increases in response to NMDAR stimulation in neuronal dendrites. Images show dendrites taken from boxed region in (B), above. Graph shows Pearson's co‐localisation coefficients; n = 4 independent experiments (18–24 cells per condition). *P < 0.05, t‐test. Scale bar = 10 μm. Mean ± SEM.
- Line‐scan analyses of Ago2 and GW182 fluorescence intensities in control and NMDA‐stimulated dendrites shown in (C).
- NMDAR stimulation has no effect on endogenous Ago2‐GW182 co‐localisation in neuronal cell bodies. Images show cell bodies taken from boxed region in (B). Graph shows Pearson's co‐localisation coefficients; n = 4 independent experiments (18–20 cells per condition), t‐test. Scale bar = 10 μm. Mean ± SEM.
Source data are available online for this figure.