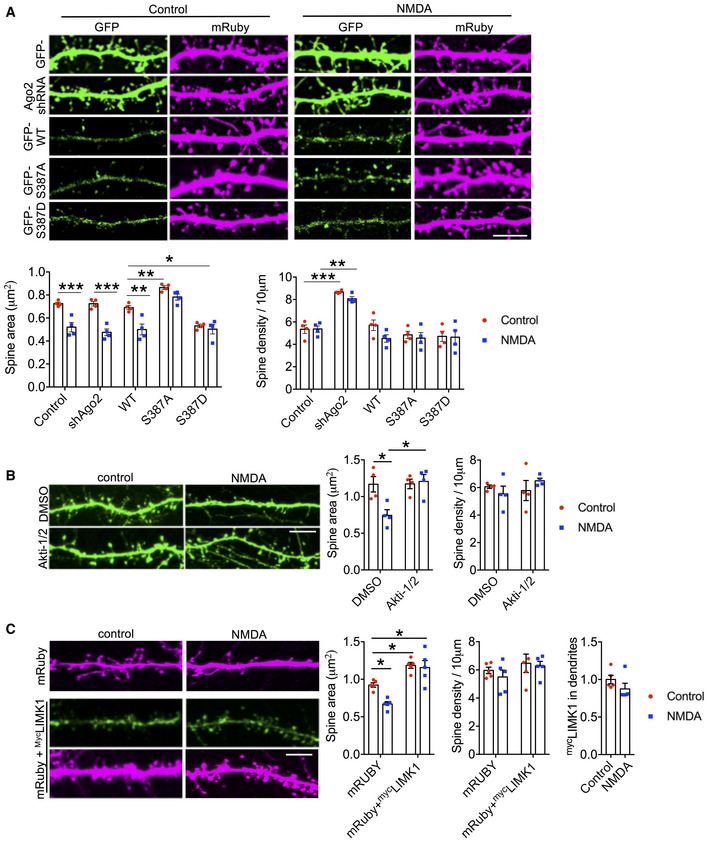
Figure 7. NMDA‐induced dendritic spine shrinkage requires Akt activation, Ago2 phosphorylation at S387 and miRNA‐mediated reduction in LIMK1 expression.

- S387 phosphorylation is required for NMDA‐induced spine shrinkage. Cortical neurons were co‐transfected with mRUBY as a morphological marker, and molecular replacement constructs expressing Ago2 shRNA plus shRNA‐resistant GFP‐Ago2 (WT, S387A or S387D). Forty minutes after NMDA or vehicle application, cells were fixed, permeabilised and stained with anti‐mCherry antibody to amplify the mRUBY signal, from which spine size and density were measured. Graph shows quantification of spine size and spine density; n = 4 independent experiments (nine cells per condition). *P < 0.05; **P < 0.01; ***P < 0.001; two‐way ANOVA, Bonferroni post hoc test. Scale bar = 10 μm. Mean ± SEM.
- Akt activation is required for NMDA‐induced spine shrinkage. Cortical neurons were transfected with GFP as a morphological marker, and Akti‐1/2 was applied 20 min before NMDA or vehicle application. Forty minutes after NMDA washout, cells were fixed, and spine size and density were measured. Graph shows quantification of spine size and spine density; n = 4 independent experiments (10 cells per condition). *P < 0.05; two‐way ANOVA, Bonferroni post hoc test. Scale bar = 10 μm. Mean ± SEM.
- Loss of LIMK1 is required for NMDA‐induced spine shrinkage. Cortical neurons were co‐transfected with mRUBY as a morphological marker, and mycLIMK1 or empty vector. Forty minutes after NMDA or vehicle application, cells were fixed, permeabilised and stained with anti‐myc antibody (green) and anti‐mCherry antibody (magenta) to amplify the mRUBY signal, from which spine size and density were measured. Graphs show quantification of spine size (left), spine density (middle) and mycLIMK1 expression (right); n = 5 independent experiments (10 cells per condition). *P < 0.05; two‐way ANOVA, Bonferroni post hoc test. Scale bar = 10 μm. Mean ± SEM.
Source data are available online for this figure.
