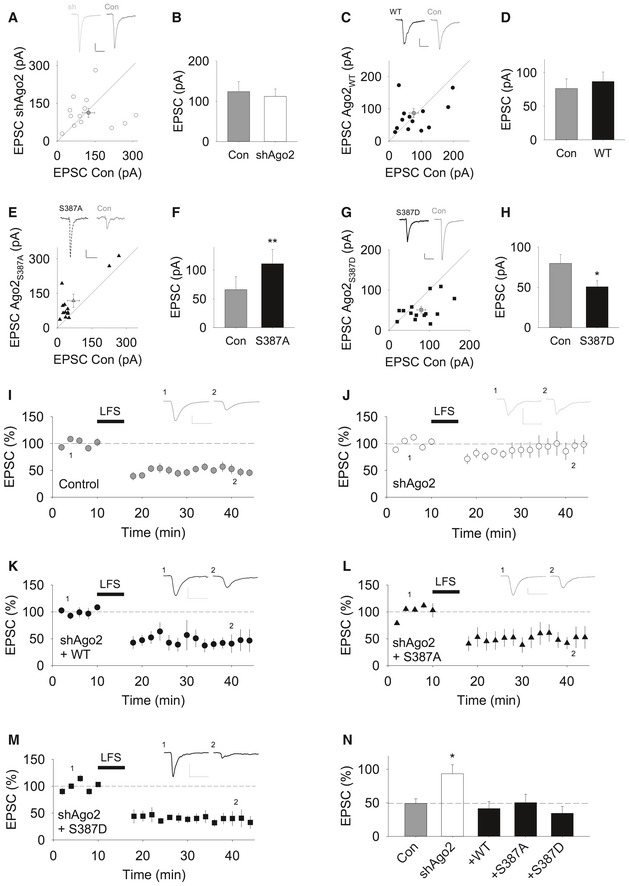
Ago2 knock down has no effect on basal synaptic transmission. EPSCs from a neuron transfected with Ago2 shRNA and a neighbouring untransfected control neuron in response to identical stimulation are plotted (n = 13 pairs). White dots = individual comparisons, grey dot = mean responses ± SEM. Insets show representative traces. Calibration bars: 20 pA, 50 ms.
Quantification of experiments shown in (A). Values are mean ± SEM.
Molecular replacement with GFP‐WT‐Ago2 has no effect on basal synaptic transmission. EPSCs from a neuron transfected with Ago2 shRNA plus GFP‐WT‐Ago2 and a neighbouring untransfected neuron in response to identical stimulation are plotted (n = 13). Black dots = individual comparisons, grey dot = mean responses ± SEM. Calibration bars: 20 pA, 50 ms.
Quantification of experiments shown in (C). Values are mean ± SEM.
Molecular replacement with GFP‐S387A‐Ago2 increases basal synaptic transmission. EPSCs from a neuron transfected with Ago2 shRNA plus GFP‐S387A‐Ago2 and a neighbouring untransfected neuron in response to identical stimulation are plotted (n = 13). Black triangles = individual comparisons, grey triangle = mean responses ± SEM. Calibration bars: 20 pA, 40 ms.
Quantification of experiments shown in (E). **P < 0.01, paired t‐test. Error bars represent mean ± SEM.
Molecular replacement with GFP‐S387D‐Ago2 decreases basal synaptic transmission. EPSCs from a neuron transfected with Ago2 shRNA plus GFP‐S387D‐Ago2 and a neighbouring untransfected neuron in response to identical stimulation are plotted (n = 14). Black squares = individual comparisons, grey square = mean responses ± SEM. Calibration bars: 20 pA, 50 ms.
Quantification of experiments shown in (G). Values are mean ± SEM. *P < 0.05, paired t‐test.
A pairing protocol (360 pulses at 1 Hz, delivered while the neuron is held at −40 mV) results in LTD in untransfected neurons (n = 9). Calibration bars for this and all following example traces: 50 pA, 50 ms. Error bars are mean ± SEM.
LTD is blocked in neurons transfected with Ago2 shRNA (n = 6). Error bars are mean ± SEM.
Co‐expression of sh‐resistant GFP‐WT‐Ago2 rescues the block of LTD (n = 5). Error bars are mean ± SEM.
Co‐expression of GFP‐S387A‐Ago2 rescues the block of LTD (n = 5). Error bars are mean ± SEM.
Co‐expression of GFP‐S387D‐Ago2 rescues the block of LTD (n = 5). Error bars are mean ± SEM.
Summary LTD data in panels (I–M). * P < 0.05, one‐way ANOVA followed by post hoc Bonferroni correction. Error bars are mean ± SEM.