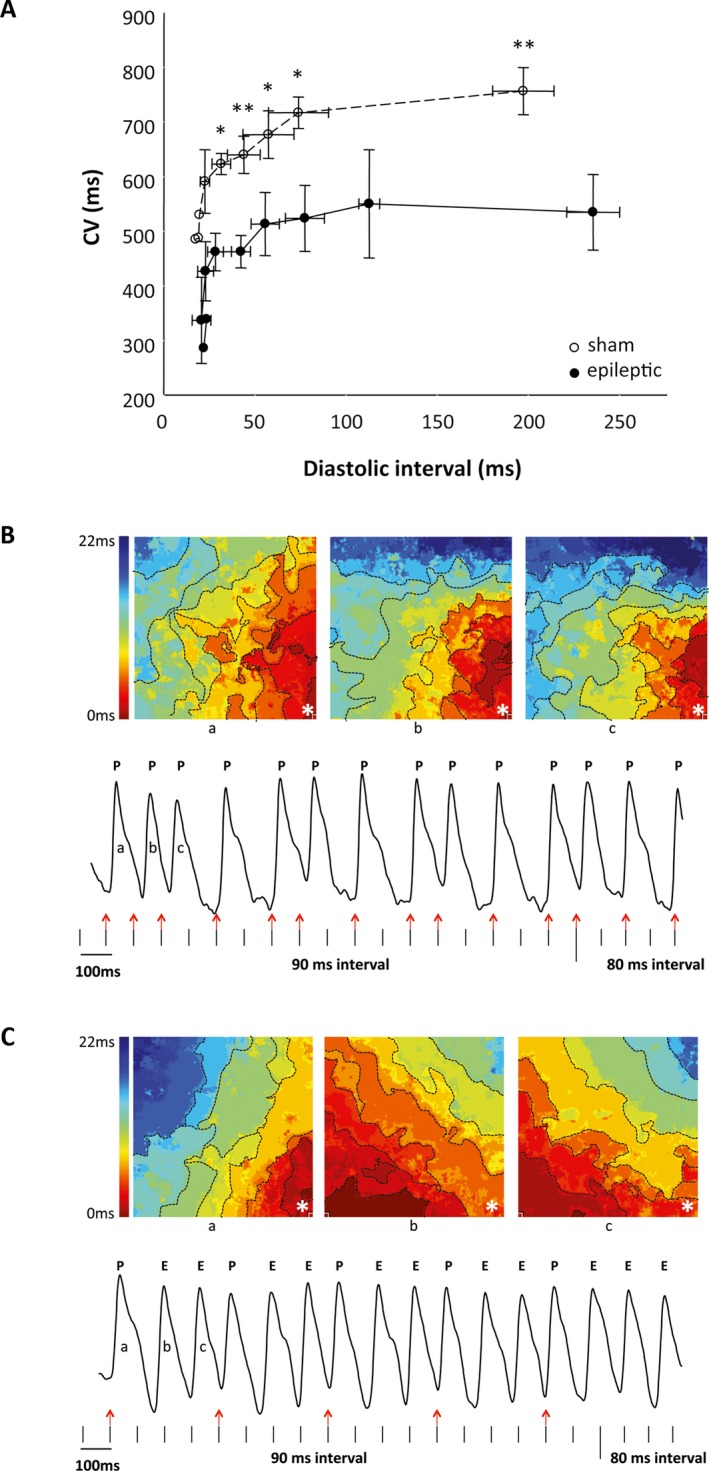
Figure 3.

Epileptic animals exhibited altered cardiac electrical properties and increased ventricular excitability. A, Ex vivo optical mapping using voltage‐sensitive dye RH237 and incrementally faster electrical pacing revealed slower conduction velocity (CV) in epileptic (open circles) compared to sham animals (closed circles) at all cycle lengths. n = 5/group. * p < 0.05. ** p < 0.01. B, C, Sample tracings of the isochronal maps (top) and corresponding voltage‐dependent fluorescence intensity (bottom) are shown from a sham (B) and an epileptic animal (C). Vertical marks represent electrical stimulation. B, In the sham animals, all the action potentials (P) were elicited by the electrical stimulation (red arrows). The isochronal maps for the first 3 action potentials (beats a, b, c) in the sham demonstrate that they originated at the site of the electrical stimulation (*) and propagated in the same direction. C, In the epileptic animals, electrical stimulations that elicited action potentials (red arrows) also triggered additional ectopic action potentials (E). The corresponding isochronal maps for the ectopic beats (beats b, c) demonstrated different origin and direction of propagation away from the site of the electrical stimulation (*).
