
Figure 3.
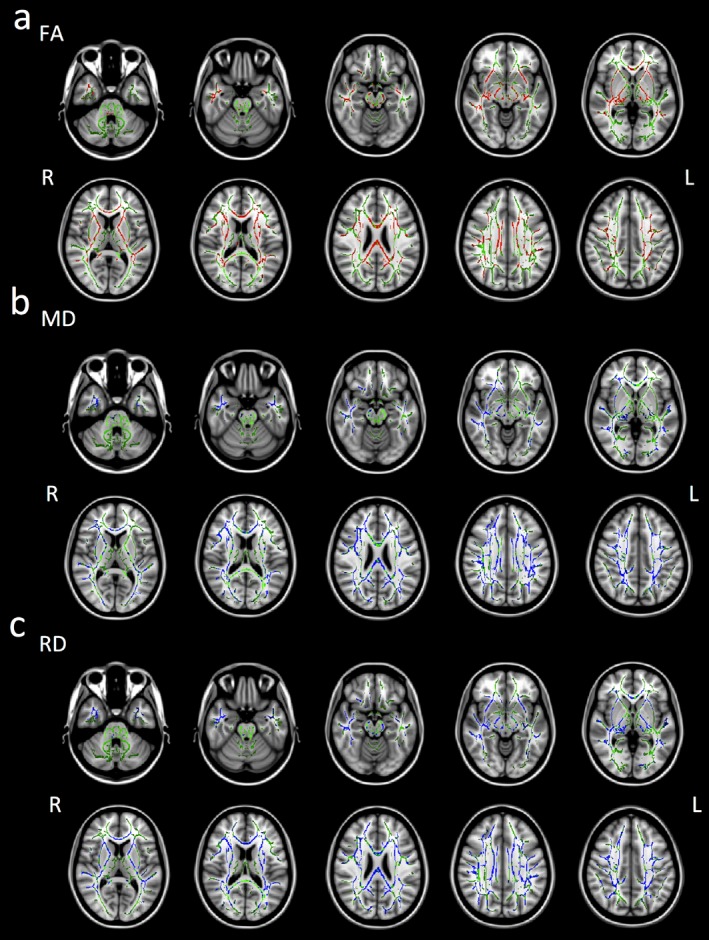
Brain regions whose DTI parameters were significantly correlated with duration of illness using a linear regression analysis with TBSS (p < 0.05, corrected for multiple comparisons with the permutation method with age and sex as nuisance covariates). Green indicates the mean FA skeleton of the TLE groups. (A) Red indicates brain regions where FA values were negatively correlated with duration of illness. (B) Blue indicates brain regions where MD values were positively correlated with duration of illness. (C) Blue indicates brain regions where RD values positively correlated with duration of illness. Axial slices from Z = −32 to 40 in MNI coordinate are shown at intervals of 8 for FA, MD, and RD, respectively. L, left; R, right.