
Figure 3. Melatonin suppression and circadian phase resetting are not functionally coupled.
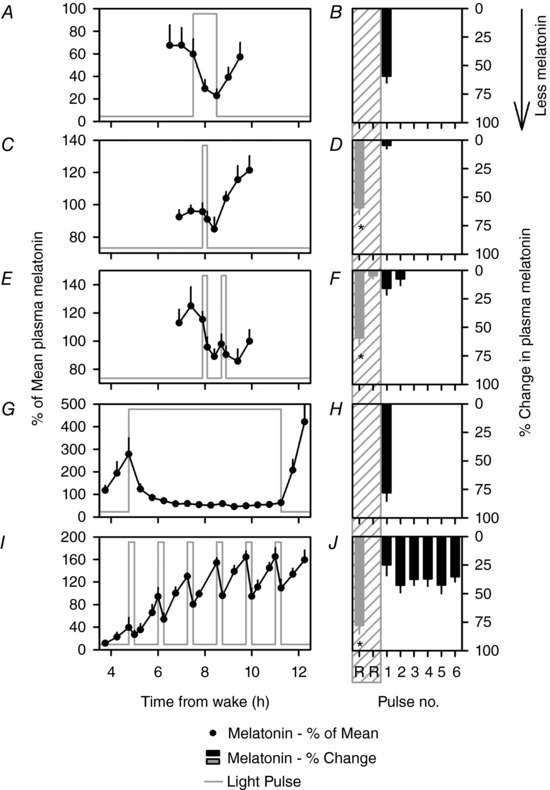
Melatonin levels are expressed as a percentage of the mean during the 8 h interval from 22.00 to 06.00 h shown by hatched bars in Fig. 1 A and B, which contains the light exposure for each individual, and then compared across individuals in the 1.0 h continuous (A), 0.2 h continuous (C), 1.0 h IBL (E), 6.5 h continuous (G) and 6.5 h IBL (I) conditions (mean ± SEM). Values were interpolated at the start and end of the light pulse and in 0.5 intervals starting 1 h before the pulse and ending 1.0 h after the pulse. The light pulse is shown as the grey line. The corresponding change in melatonin levels from each pulse calculated as the percentage change between the start and end of the light pulse is shown as black bars in B, D, F, H and J (mean ± SEM; *signifies P < 0.05). This method of calculating melatonin suppression is different from the AUC‐based method used for calculating suppression in Fig. 2, and allows for calculating the change in melatonin from the start to the end of each intermittent and continuous light pulse. The corresponding continuous conditions used as a comparative reference (denoted as Pulse no. R) are re‐plotted as grey bars in the grey hatched area. For the 1.0 h IBL condition, the comparator conditions include the 1.0 h and the 12 min continuous conditions. For the 6.5 h IBL condition, the comparator condition includes the 6.5 h continuous condition.