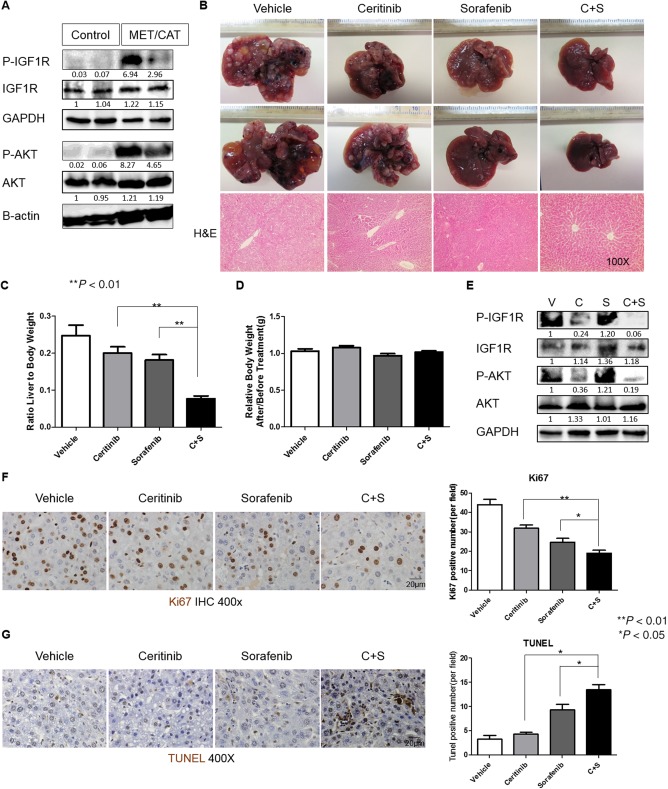
Figure 6.

Ceritinib enhanced the efficacy of sorafenib in inhibiting tumor growth in the MET/CAT‐driven HCC model. (A) Expressions of p‐IGF1R, IGF1R, p‐AKT, AKT, and GAPDH proteins were detected by western blotting in the livers of five C57B6/J mice 8 weeks after hydrodynamic injection of MET/CAT or pT3 control. (B) Photographs (magnification, 0.5x) and H&E staining of livers of C57B6/J mice 6 weeks after injection of MET/CAT followed by treatment with vehicle (30% captisol), ceritinib (25 mg/kg), sorafenib (25 mg/kg), or a combination of ceritinib and sorafenib for 4 weeks. (C) Liver weight/body weight ratios were analyzed in mice from (B) (n = 5). (D) Mouse weight ratios (after/prior to treatment) of mice from (B) (n = 5). (E) Expressions of p‐IGF1R, IGF1R, p‐AKT, AKT, and GAPDH proteins in mice from (B) were examined by western blotting. (F) Proliferation in liver tumors from (B) was examined by immunohistochemistry for Ki67. (G) Apoptosis in liver tumors from (B) was examined by TUNEL staining. Each experiment was repeated at least 3 times. Abbreviations: C, ceritinib; GAPDH, glyceraldehyde 3‐phosphate dehydrogenase; H&E, hematoxylin and eosin; IHC, immunohistochemistry; S, sorafenib; V, vehicle. Values in C, D, F and G were mean ± SD (n = 5 for C and D in each group, and n = 3 for F and G in each group).
