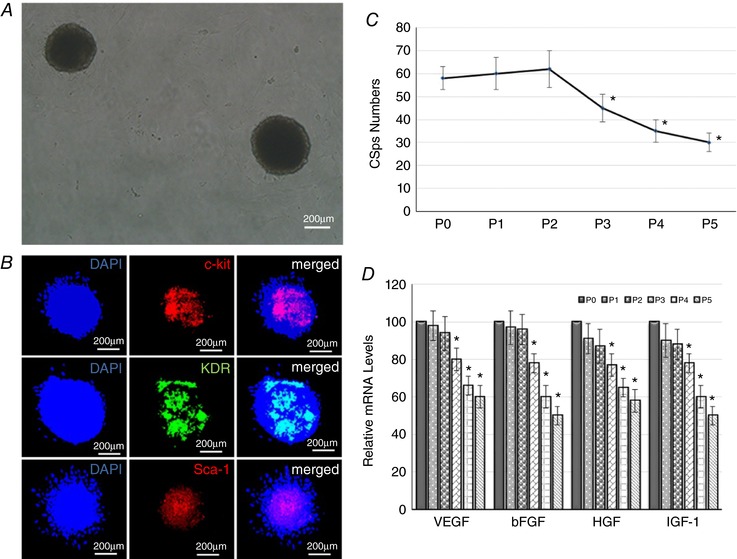
Figure 1. Characteristics of CSps in culture.

A, morphology of CSps in in vitro culture (P2 generation); B, number of CSps generated in different passages (n = 10 dishes per generation); C, expression of c‐kit, sca‐1 and KDR in CSps by immunofluorescence staining (n = 5); D, gene expression levels of VEGF, bFGF, HGF and IGF‐1 in different culture passages by real‐time quantitative PCR (n = 3 per generation). * P < 0.05 versus P0.
