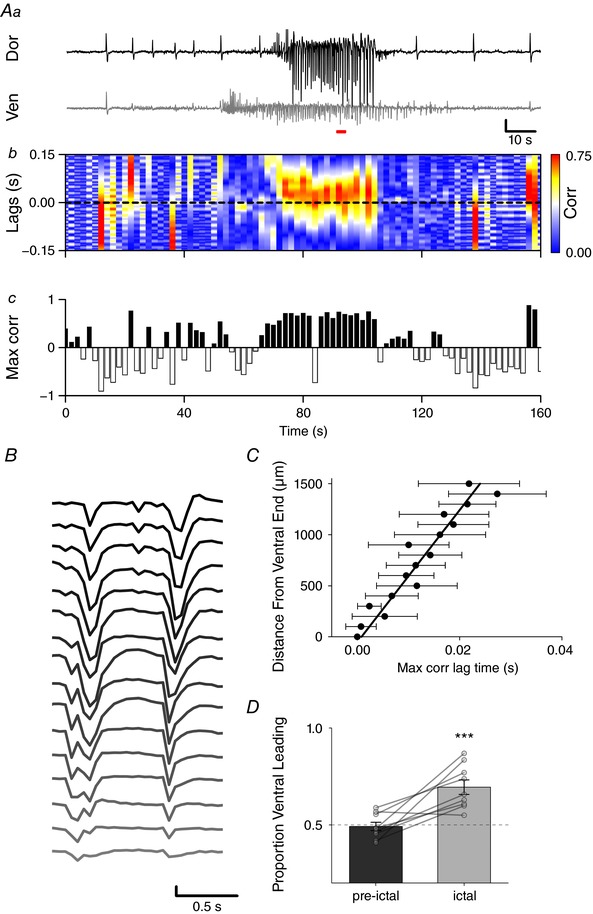
Figure 4. Intra‐ictal burst waveforms initiated in ventral mEC regions.

Aa, example traces from most dorsal (top) and ventral (bottom) recording sites of electrode array (scale bar: 100 μV, 10 s). b, binned cross correlations for every 1 s of data. c, correlation values are shown in the colour axis, with positive peaks indicating ventral‐leading activity and negative peaks dorsal‐leading. B, example of intra‐burst activity across 16‐shank electrode array initiating in ventral mEC during red bar in A (scale bar: 200 μV, 0.5 s). C, lag time associated with peak cross correlation between most ventral sites and each dorsal recording electrode, showing linear increase with distance from ventral pole (linear regression: R 2 = 0.93, P < 0.001, slope = 55.9 ± 5 mm s−1). D, proportion of 1 s time bins with correlation peaks in the positive (ventral leading) was greater during ictal events when compared to non‐ictal bins (paired t test, P = 0.002, n = 10 slices from 8 animals). *** P < 0.001. [Color figure can be viewed at http://wileyonlinelibrary.com]
