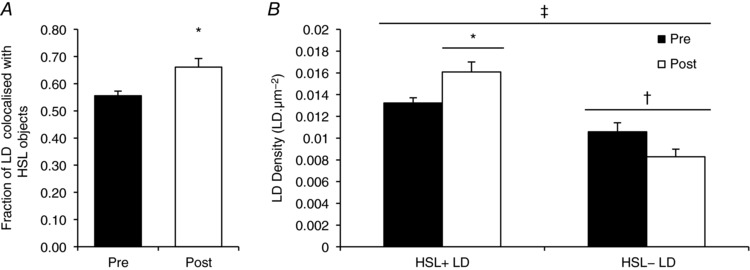
Figure 3. HSL redistributes from larger storage clusters to smaller more frequent clusters after exercise, resulting in an increase in LD colocalisation to HSL.

Quantification derived from confocal immunofluorescence microscopy images. A, colocalisation analysis was performed to determine the fraction of LDs overlapping with HSL objects before and after exercise. B, subsequently, the number of LDs colocalised with HDL (HSL+ LDs) or not colocalised with HSL (HSL− LDs) was calculated and pre‐ and post‐exercise values were compared. Data collected are averages of 15 fibres per participant per time point. Values are given as means ± SEM (n = 8 per group). †Main effect for HSL colocalisation to LDs (P < 0.05 vs. HSL− LDs). ‡Main interaction effect for HSL colocalisation to LDs after exercise (P < 0.05). Post hoc analysis revealed an increase in HSL+ LDs (* P < 0.05 versus pre‐exercise) and a trend towards a decrease in HSL− LDs (P = 0.063 versus pre‐exercise).
