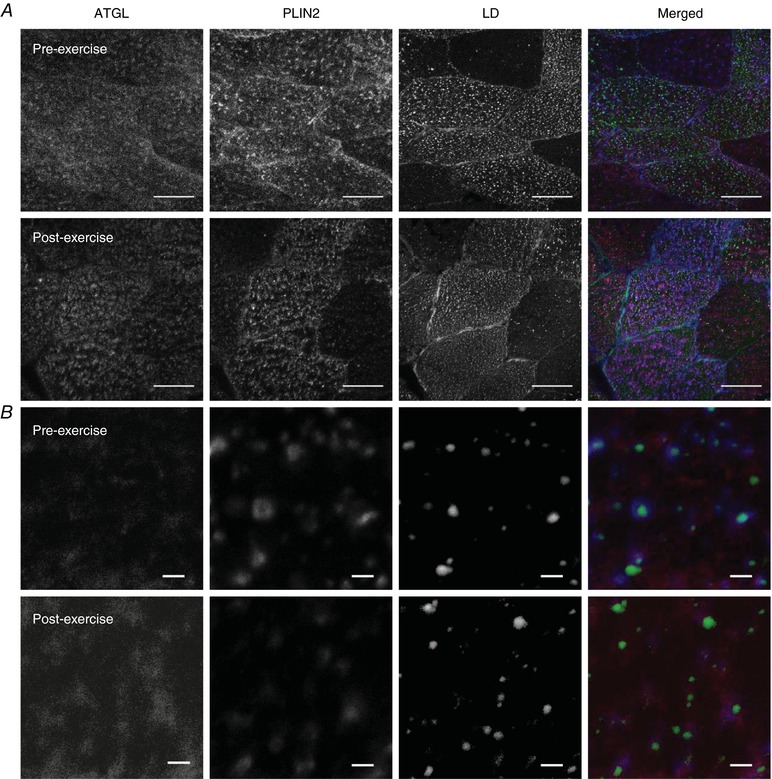
Figure 4. ATGL distribution does not change after exercise as visualised through immunofluorescence microscopy.

A, representative images of ATGL, PLIN2 and LDs before and after exercise obtained using a 63× oil objective on a confocal microscope. Scale bars represent 50 μm. LDs were visualised using BODIPY 493/503 and represent IMTG stores within the cell. Muscle fibres that had the highest lipid droplet content were selected and analysed. B, an 8× digital magnification was then applied to the centre of these muscle fibres and images were obtained to identify and quantify distribution and colocalisation between ATGL and LDs associated with either PLIN2 or PLIN5 (not shown). Scale bars represent 2 μm. Panels A and B show that pre‐exercise ATGL had punctate staining throughout the cell and this was unaltered post exercise. [Color figure can be viewed at http://wileyonlinelibrary.com]
