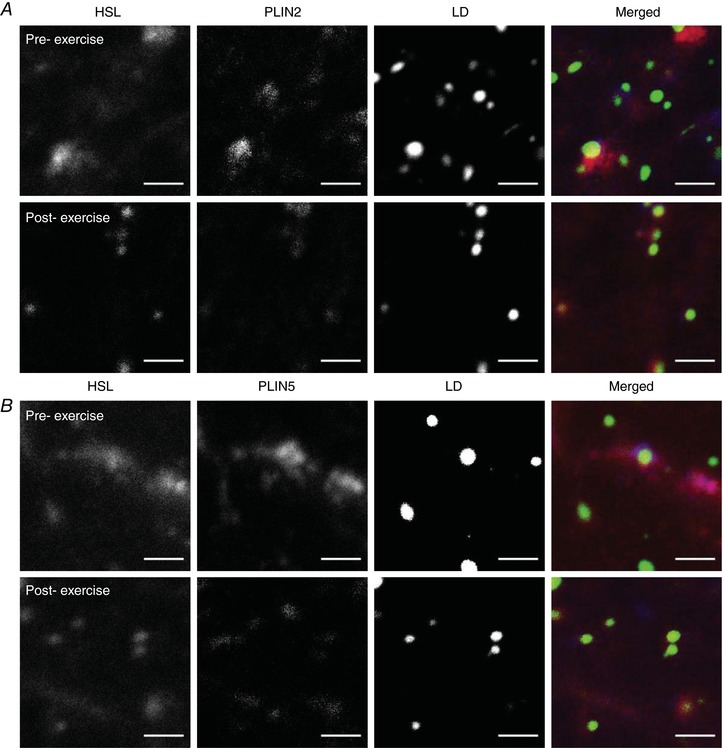
Figure 5. Immunofluorescence microscopy images of HSL, PLIN2/PLIN5 and LDs before and after exercise.

Colocalisation between HSL, LDs and PLIN2 (A) or PLIN5 (B) as visualised through immunofluorescence microscopy and quantified before and after exercise. Images captured with a 63× oil objective on a confocal microscope at 16× digital magnification in the central region of fibres that had the highest lipid droplet content. Scale bars represent 2 μm. PLIN2 (A) and PLIN5 (B) were associated with LDs or located in the cytosol. HSL redistributes from larger storage clusters to a greater number of smaller, discrete clusters centred on different subclasses of LDs (i.e. PLIN+ or PLIN− LDs). [Color figure can be viewed at http://wileyonlinelibrary.com]
