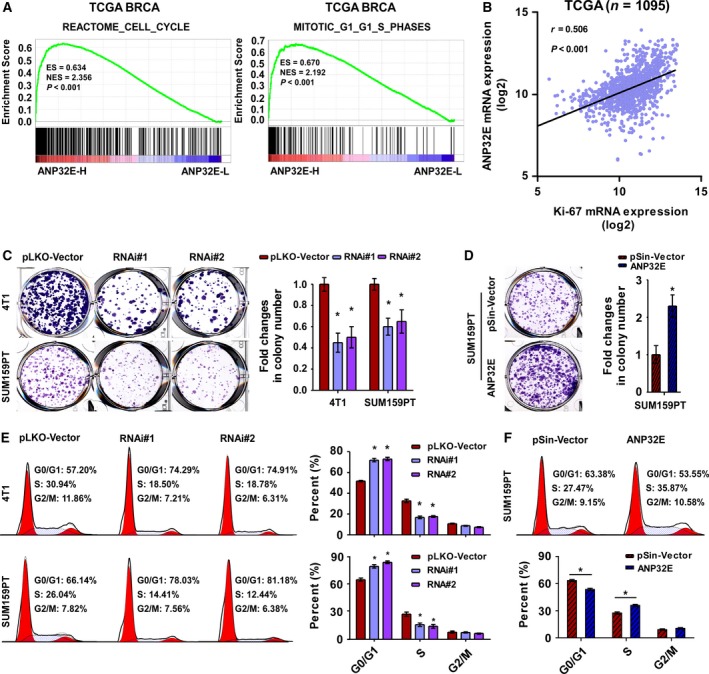
Figure 4.

ANP32E induces cell proliferation by promoting the G1/S transition in TNBC cells. (A) The GSEA plot generated using GSEA v2.2.0 (http://www.broadinstitute.org/gsea/) showed that high ANP32E expression positively correlated with cell cycle‐related (REACTOME_CELL_CYCLE) and G1/S‐related (MITOTIC_G1_G1_S_PHASE) signatures based on the TCGA BRCA (TNBC) mRNA dataset. (B) Correlation between mRNA levels of ANP32E and Ki‐67 based on the TCGA BRCA mRNA dataset. r, Pearson correlation coefficient; P < 0.001. (C, D) Representative images (left) and quantification (right) of colony formation for the ANP32E‐inhibited (C) and ANP32E‐overexpressing (D) cell lines. (E and F) Flow cytometric analysis of indicated cell lines. *P < 0.05.
