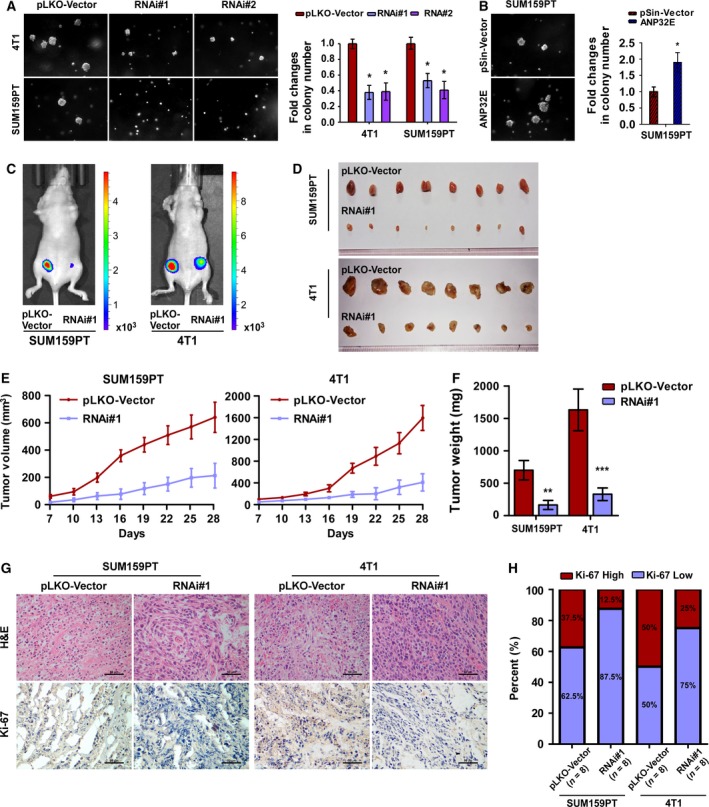
Figure 5.

ANP32E downregulation suppresses tumorigenesis and proliferation of TNBC cells. (A, B) Representative images (left) and quantification (right) of anchorage‐independent growth colony formation for the indicated cell lines. (C) Xenograft model in nude mice. Representative images of tumor‐bearing mice (C) and tumors (D) formed by indicated cell lines. (E) Volumes of tumors formed by the indicated cells were measured every 3 days beginning at Day 7. Data were recorded as the means ± SD of three independent tests. (F) Weight of tumors formed by indicated cells were recorded as the means ± SD. (G) H&E staining and IHC staining for of Ki‐67 were performed on tumors of nude mice. (H) Quantification of Ki‐67 staining in tumors formed by SUM159PT and 4T1. *P < 0.05, **P < 0.01, ***P < 0.001.
