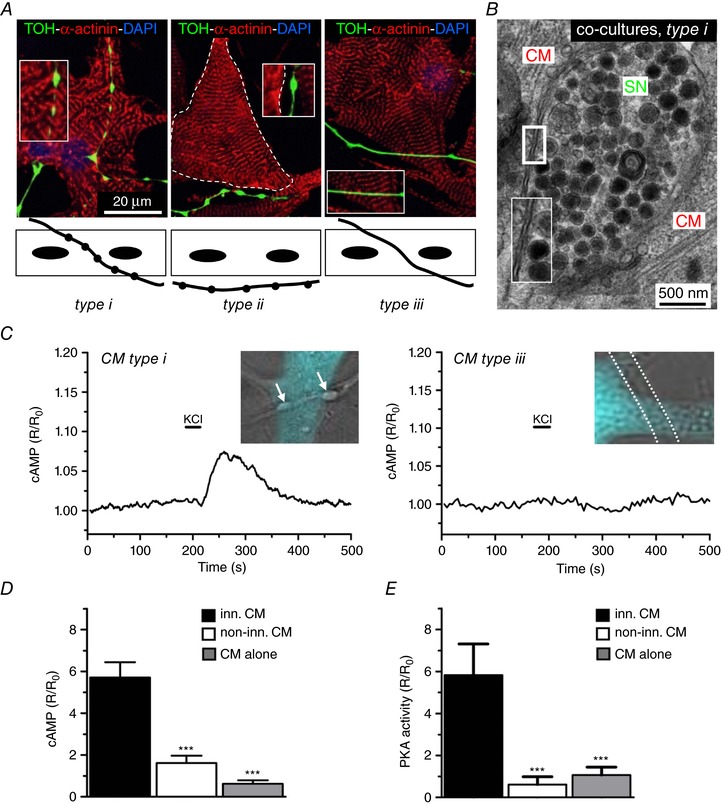
Figure 3. Selective signalling of SNs to target innervated cardiomyocytes.

A, IF staining on 15 day co‐cultures stained with antibodies to: sarcomeric actinin (α‐actinin) and TOH. Nuclei were counterstained with 4′,6‐diamidino‐2‐phenylindole. Confocal images (top) and schematic representations (bottom) of the different types of SN‐CM interactions observed in our experimental settings. B, electron microscopy on 15‐day co‐cultures. C, representative traces of cAMP changes in Epac1‐camps expressing CMs, upon SN depolarization, measured in innervated [type (i), left ], or non‐innervated [type (iii), right] CM (for details, see text). D, statistics of cAMP responses in corresponding groups. Bars indicate the SEM (*** P < 0.001; n = 20 CMs for each group). E, statistics of the PKA activity in response to KCl stimulation of SCGNs, in differently innervated CMs. Bars indicate the SEM (*** P < 0.001; n = 20 CMs for each group).
