
Figure 5. In vitro assessment of [NE] in the synaptic cleft.
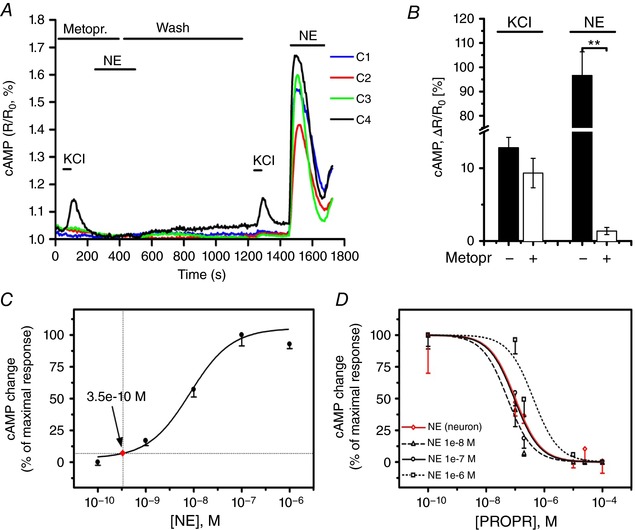
A and B, representative plot (A) and statistics (B) of cAMP changes in innervated vs. non‐innervated CMs upon neuronal depolarization, both in the absence and presence of the β1‐blocker metoprolol (100 μm). NE (100 nm) added to the culture medium was used to compare the effect of neuronal vs. diffuse stimulation. Bars indicate the SEM (** P < 0.01; n = 20 innervated, n = 63 non‐innervated CMs). C, dose‐effect curve of cAMP responses to NE directly applied to Epac1 expressing CMs. Arrow indicates the average cAMP response observed in co‐cultures. D, propranolol inhibition curve of cAMP responses elicited by neuronal stimulation (red trace), overlapped to that resulting from direct treatment of CMs with known [NE] (n = 6 measures for each point).