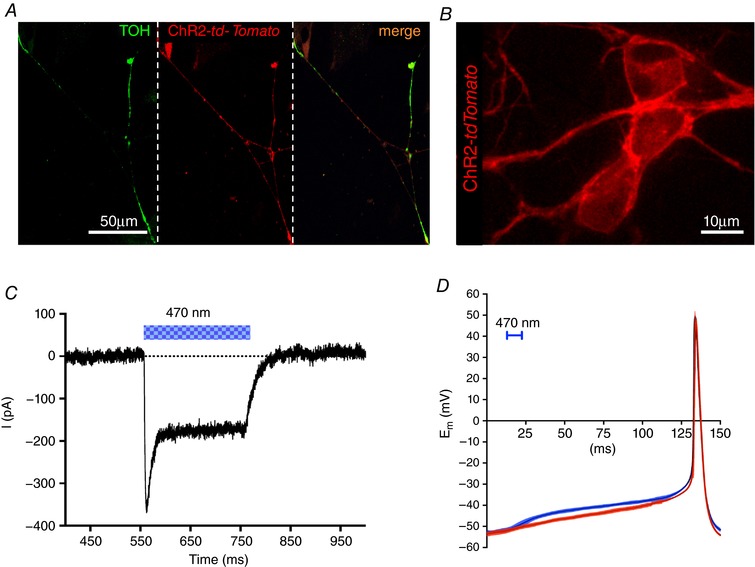
Figure 8. Optogenetic modulation of cultured SNs.

A, confocal IF analysis on cultured SNs from TOH/ChR2 mice stained with an antibody to TOH (left). Middle: fluorescence image of td‐Tomato. Right: merged image of the two signals. B, confocal image analysis on cultured TOH/ChR2 SNs. C, patch clamp recording of ChR2 photocurrent elicited by light stimulation (blue bar) in cultured TOH/ChR2 SNs. D, comparison of spontaneous (red) and light‐induced (blue) (10 ms, 470 nm light pulse) APs in cultured TOH/ChR2 SNs (n = 12 per group). Colour filled area indicates SD.
