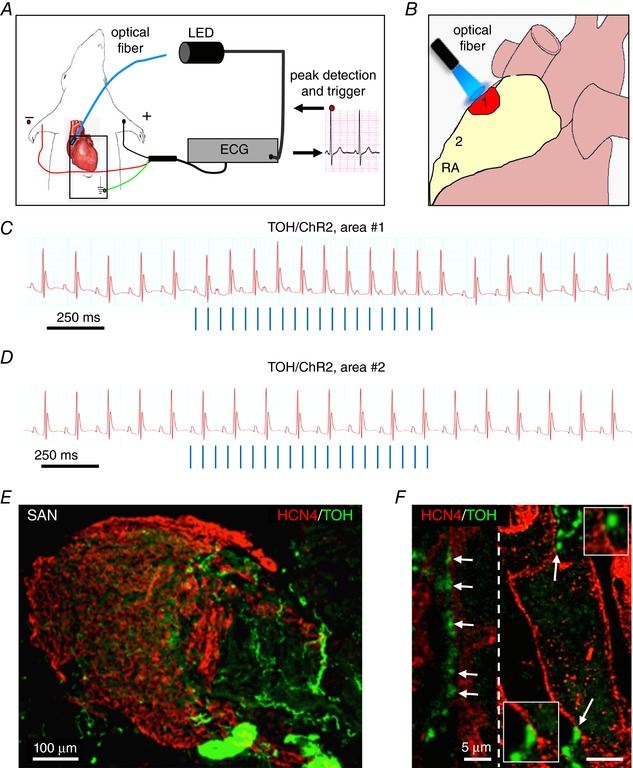
Figure 9. Optogenetic control of cardiac CNs in vivo .

A, schematic illustration of the neuronal optogenetic set up used for right atrium illumination in open‐chest anaesthetized mice. B, representation of the different photostimulated atrial regions (areas#1–2). C, representative ECG trace of the optogenetic experiment, showing positive chronotropic response upon photoactivation (blue lines) of the right atrial area#1 in TOH/ChR2 mice. D, representative trace showing unchanged HR upon illumination of area#2. Behaviour of experiments (C and D) was observed in n = 15 mice. E and F, area#1 was analysed with double IF with SAN (HCN4) and SN (TOH) markers. The magnified image (F) highlights the close interaction between SN varicosities and SAN myocytes (left) and an example of multiple neuronal processes interacting with the same myocyte (right).
