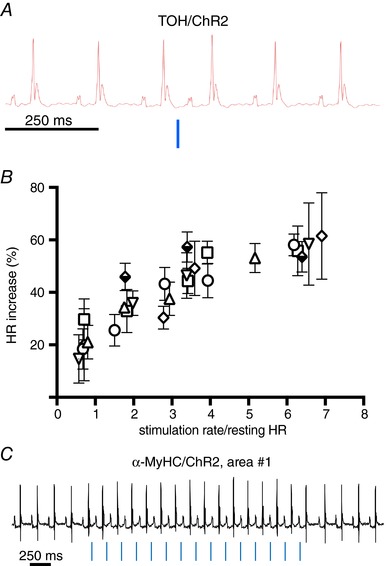
Figure 10. Optogenetic control of cardiac neurogenic responses in vivo .

A, chronotropic effect of single neuronal photoactivation pulse (10 ms, blue line) delivered to area#1. B, relationship between neuronal photostimulation rate and chronotropic effect (% HR increase). Each point is the average of 10 repeats, and error bars show the 95% confidence interval (CI). Experiments were repeated in n = 6 different mice, each indicated by a unique symbol. Multiple comparison was performed with two‐way ANOVA followed by Tukey's test. C, representative ECG trace of sympathetic optogenetic experiment, showing atrial pacing (chronotropic stimulation at fixed light/p‐wave delay) upon photoactivation (blue lines) of the right atrial area#1 in α‐MyHC/ChR2 mice. The same behaviour was observed in all α‐MyHC/ChR2 mice analysed (n = 6) (Zaglia et al. 2015).
