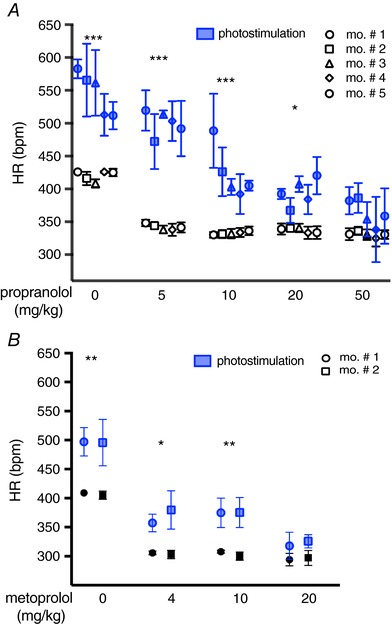
Figure 11. Assessment of the efficiency of neurocardiac coupling in vivo .

A, dose‐effect analysis of the treatment with the β‐AR antagonist, propranolol, on the chronotropic response to neuronal photostimulation. Blue symbols identify responses to the photostimulation train. Each point is the average of six to 10 repeats, and error bars show the 95% confidence interval (CI). Experiments were repeated in n = 5 different mice, as shown in the caption. Multiple comparison was performed with two‐way ANOVA followed by Tukey's test. Asterisks in each group represent comparison of resting vs. photostimulated HR values (*** P < 0.001; * P < 0.05). B, dose‐effect analysis of the treatment with the β1‐AR antagonist, metoprolol, on the chronotropic response to neuronal photostimulation. Blue symbols identify responses to the photostimulation train. Each point is the average of four to six repeats, and error bars show the 95% CI. Experiments were repeated in n = 2 different mice, as shown in the caption. Multiple comparison was performed with two‐way ANOVA followed by Tukey's test. Asterisks in each group represent comparison of resting vs. photostimulated HR values (** P < 0.01; * P < 0.05).
