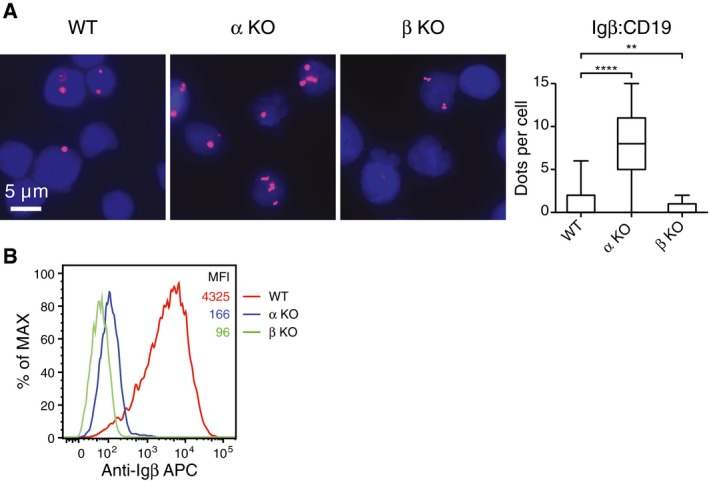
Figure EV2. Fab‐PLA analysis of the Igβ:CD19 proximity on BCR‐negative DG75 cells.

- Measurement of the Igβ:CD19 proximity on WT, Igα KO or Igβ KO DG75 B cells by Fab‐PLA. The data are representative of three independent experiments. P‐values were calculated by non‐parametric Mann–Whitney test. ** indicates P < 0.01, **** indicates P < 0.0001. In the box plot, horizontal lines in the middle represents median, box limits represent 25% to 75%, and lower and upper whisker represent min. and max. data range respectively.
- Expression levels of Igβ in WT, HLα KO, and HLβ KO DG75 cells were determined by flow cytometry. One clone is used for each genotype.
