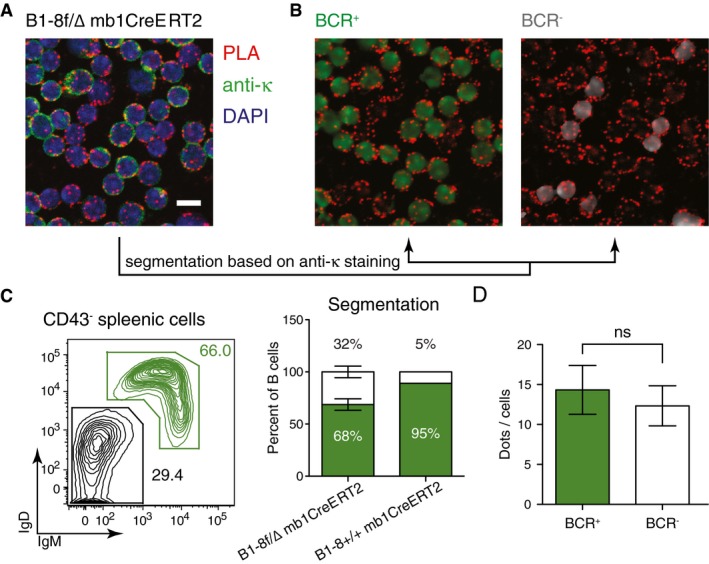
Figure EV3. 1‐PLA analysis of the Igβ:CD19 proximity on splenic B cells from a tamoxifen treated B1‐8f/Δ mb1CreERT2 mouse.

- Representative microscopic image showing splenic B cells from a tamoxifen treated B1‐8f/Δ mb1CreERT2 mouse. The different colors indicate anti‐kappa LC staining (green), DAPI staining (blue), and the PLA signals (red). Scale bar: 5 μm.
- For PLA signal quantification, the image in (A) was segmented in silico to a BCR+ (green) and BCR− (gray) cell population.
- Left panel shows a representative flow cytometry analysis to determine the percentage of BCR+ cells (IgM+IgD+) and BCR− cells (IgM−IgD−) of B cells from the same spleen. Right panel shows the percentage of BCR+ and BCR− cells after in silico segmentation. It also shows that the percentage of BCR+ and BCR− cells of splenic cells from B1‐8f/Δ mb1CreERT2 mouse determined by in silico segmentation is as expected. Data represent the mean and the standard error of six experiments with each of them counting 50–200 cells.
- Quantification of the PLA signals in BCR+ and BCR− cells on the segmented images. Data represent the mean and the standard error of six experiments with each of them counting 50–200 cells. P‐values were calculated by Wilcoxon signed rank test.
