
Figure 2.
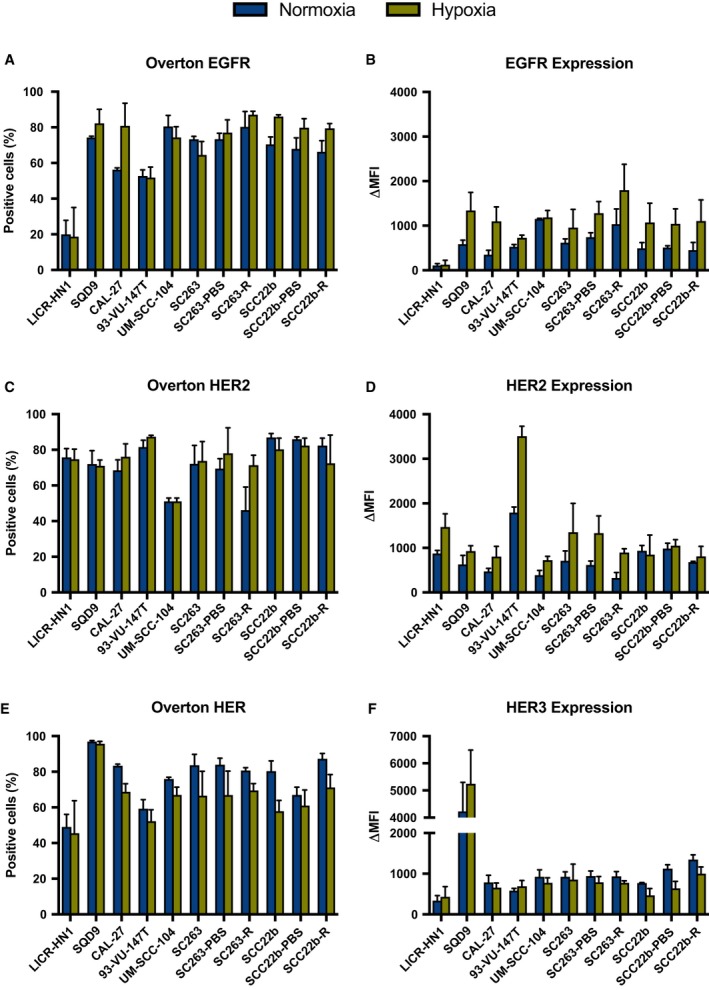
Protein levels of HER receptors under normoxic and hypoxic conditions in a panel of HNSCC cell lines with different sensitivity to cetuximab. The percentage of EGFR‐, HER2‐, and HER3‐positive cells (overton) are presented in A, C, and E, respectively. The expression levels of EGFR, HER2, and HER3 on the corresponding receptor‐positive cells (ΔMFI) are presented in B, D, and F, respectively. Protein levels were measured with the FACScan flow cytometer.