
Figure 4.
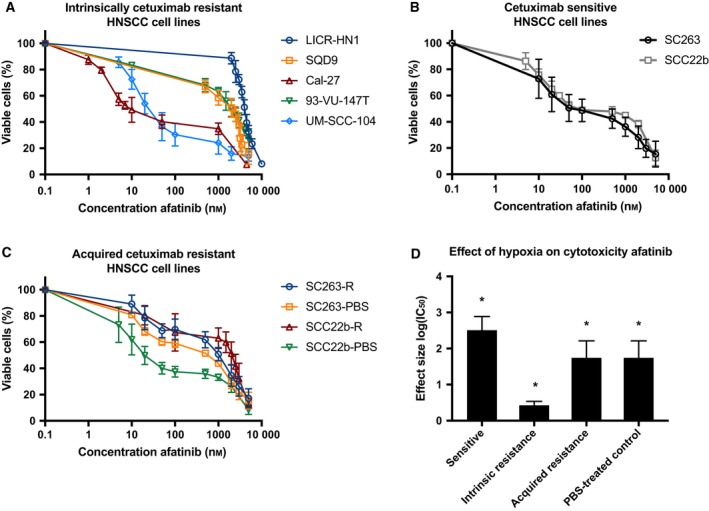
Afatinib's cytotoxicity in cetuximab‐sensitive and cetuximab‐resistant HNSCC cell lines. (A) Dose–response curves of HPV‐positive and HPV‐negative intrinsically cetuximab‐resistant HNSCC cell lines after exposure to afatinib for 72 h under normoxia. (B) Dose–response curves for the cetuximab‐sensitive HNSCC cell lines after exposure to afatinib for 72 h under normoxia. (C) Dose–response curves of acquired cetuximab‐resistant (suffix R) and corresponding cetuximab‐sensitive isogenic cell lines (suffix PBS) after exposure to afatinib for 72 h under normoxia. (D) Effect sizes with standard errors for the influence of hypoxia on afatinib's cytotoxic effect in HNSCC cell lines with different cetuximab resistance status. The average log(IC 50) of afatinib was higher under normoxia compared to hypoxia in cetuximab‐sensitive, intrinsically cetuximab‐resistant, and acquired cetuximab‐resistant HNSCC cell lines. The effect size represents the difference in mean log(IC 50) between normoxia and hypoxia. The * indicates a significant P‐value for the main effect of oxygen condition.