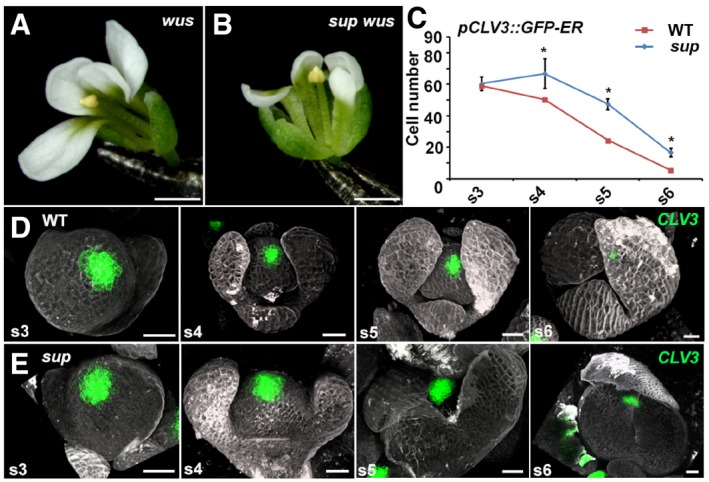
Figure 1. SUP spatially controls the FM size in a non‐cell‐autonomous manner.

-
A, Bwus‐1 (A) and sup‐5 wus‐1 (B) mutant flowers with one stamen and without carpels. Scale bars, 1 mm.
-
CThe comparison of the number of cells with the stem cell marker pCLV3::GFP‐ER signals in WT and sup‐5. The numbers of cells with the signals were counted based on the z‐stack images. From stage 4 (s4) onwards, the sup‐5 floral buds showed increased numbers of CLV3‐expressing stem cells compared with those of WT. Error bars indicate s.d. of 12–15 samples; two‐tailed Student's t‐test, *P < 0.05.
-
D, EThe pCLV3::GFP‐ER (green) in WT (D) and sup‐5 (E) floral buds at different floral stages. Scale bars, 20 μm.
