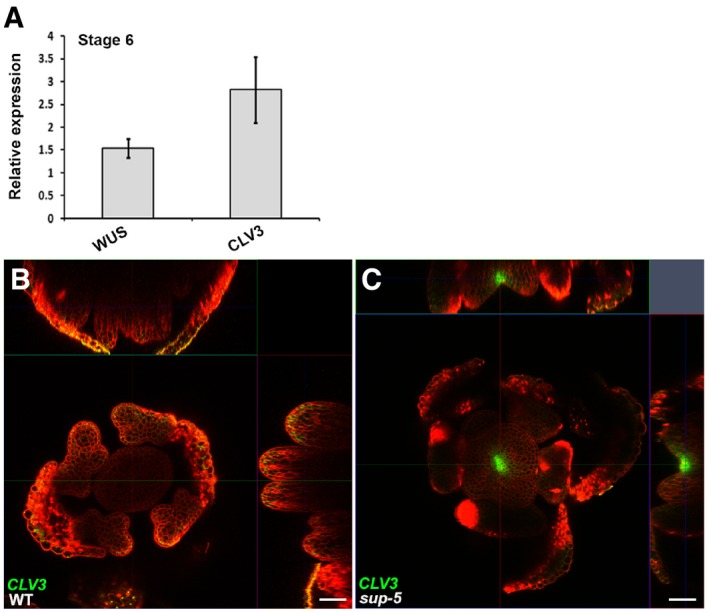
Figure EV1. WUS and CLV3 are increased at stage 6 floral buds in sup‐5 .

-
AExpression of WUS and CLV3 (in floral buds of approximately stage 6) 5 days after treatment of ap1 cal p35S::AP1‐GR sup‐5 inflorescences with 1 μM DEX. The relative values to equally treated ap1 cal p35S::AP1‐GR plants are shown. Error bars indicate standard errors from qRT–PCR experiments of four biological repeats. P = 0.028 and 0.031 for WUS and CLV3 based on a Student's t‐test, respectively.
-
B, CThe pCLV3::GFP‐ER (green) can be detected in a sup‐5 floral bud (C) but not in WT (B) at a floral stage later than 6. Scale bars, 20 μm.
