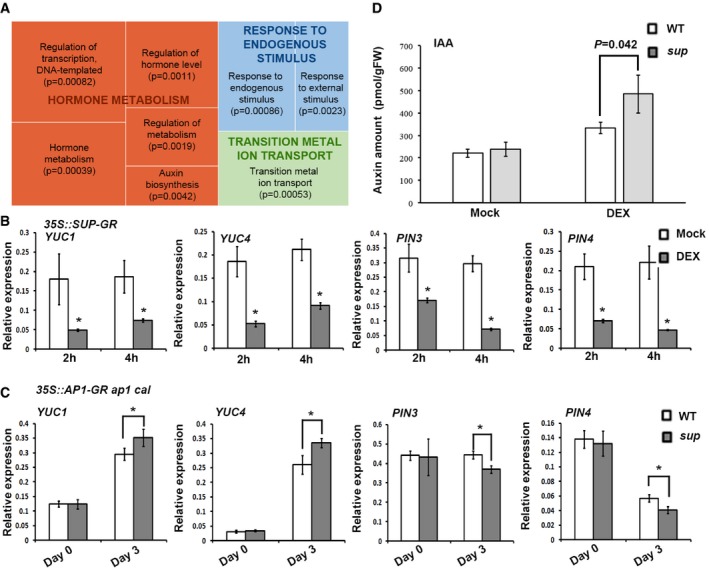
Figure 3. Increased auxin biosynthesis in the SUP‐expressing region is essential for the sup mutant phenotype.

- REVIGO analysis of pathways significantly enriched among the down‐regulated genes. Each rectangle is a single cluster representative for the non‐redundant GO term, which are joined into “superclusters” of related terms, visualized with different colors. Size of the rectangles reflects the P‐value.
- YUC1/4 and PIN3/4 are reduced in p35S::SUP‐GR inflorescences 2 and 4 h after treatment with 10 μM DEX. Error bars indicate s.d. of three biological replicates; two‐tailed Student's t‐test, *P < 0.05.
- Expression levels of YUC1/4 and PIN3/4 3 days after 1 μM DEX treatment in ap1 cal p35S::AP1‐GR sup‐5 and ap1 cal p35S::AP1‐GR. Expression of YUC1/4 was increased in the ap1 cal p35S::AP1‐GR sup‐5 background, while that of PIN3/4 was reduced. Error bars indicate s.d. of three biological replicates; two‐tailed Student's t‐test, *P < 0.05.
- IAA levels in ap1 cal p35S::AP1‐GR sup‐5 and ap1 cal p35S::AP1‐GR 3 days after treatment with 1 μM DEX or a mock solution. The P‐value was calculated using one‐way ANOVA and standard errors from three biological replicates.
