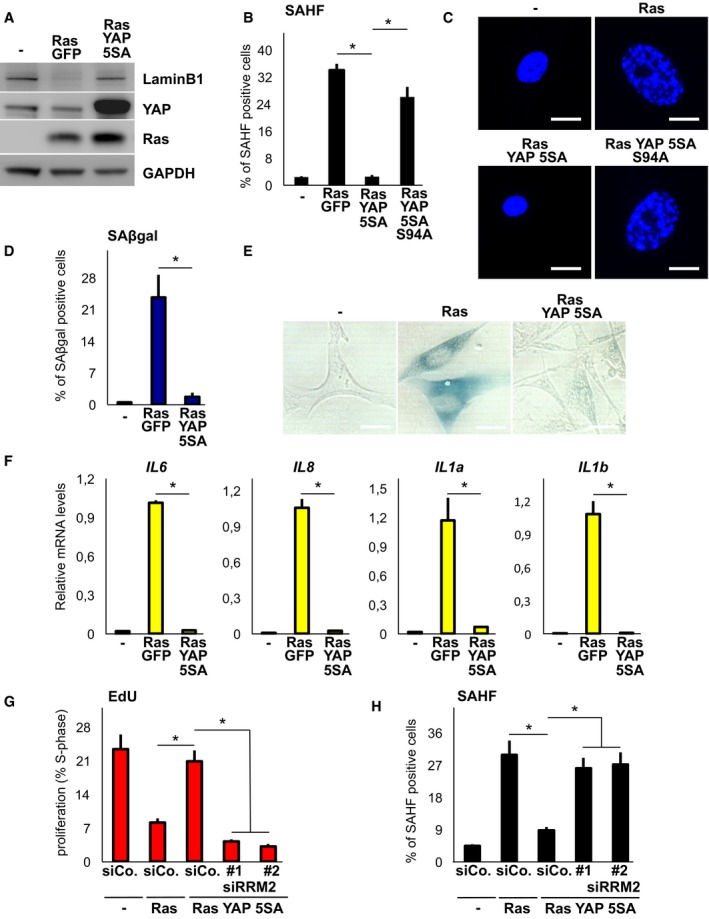
Figure 5. YAP overcomes Ras‐induced senescent phenotypes.

- Western blot analysis of WI38 cells expressing the indicated retroviral transgenes (here and throughout the figure, 6 days). GAPDH serves as loading control. Two independent experiments.
- SAHF (senescence‐associated heterochromatin foci) formation WI38 cells expressing the indicated retroviral transgenes. See Fig EV4A for further controls on Ras. Representative results of a single experiment (> 100 cells per condition); n = 3.
- Representative pictures of DAPI staining to visualize SAHF quantified in (B). Scale bar: 15 μm.
- Induction of SAβgal (senescence‐associated β‐galactosidase) activity in WI38 cells. Representative results of a single experiment (> 100 cells per condition); n = 3.
- Representative pictures of SAβgal staining quantified in (D). Scale bar: 20 μm.
- qPCR for SASP (senescence‐associated secretory phenotype) marker genes in WI38 cells. n = 6.
- Quantification of proliferating WI38 cells as measured by EdU incorporation. Control and RRM2 siRNAs were transfected 1 day after starting selection. Representative results of a single experiment (> 100 cells per condition); n = 4.
- WI38 cells were processed as in (G) but stained for SAHF. Representative results of a single experiment (> 100 cells per condition); n = 3.
