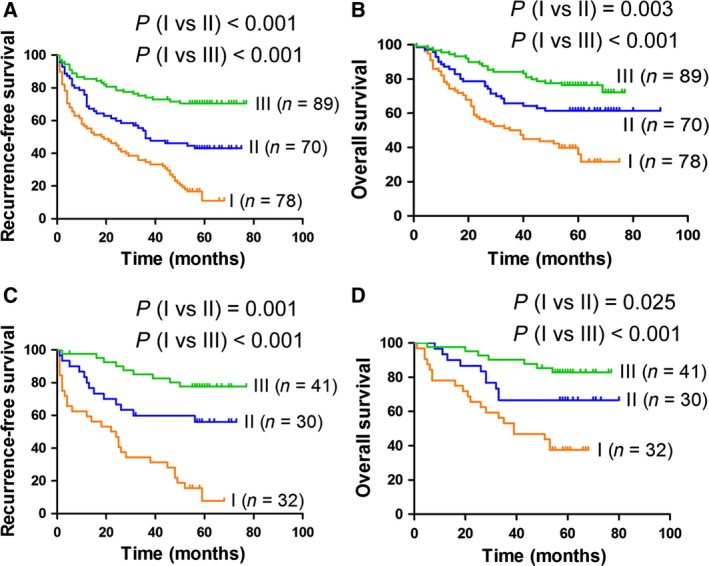
Figure 7.

Prognostic value of E‐cadherin expression and the percentage of IL‐17A‐positive cells for patients with HCC at an early stage after hepatectomy. Patients with HCC at an early stage from the TMA were used for the prognostic analysis. Patients were classified into three groups: group I, high percentage of IL‐17A+ cells and low expression of E‐cadherin; group II, high percentage of IL‐17A+ cells and high expression of E‐cadherin, or low percentage of IL‐17A+ cells and low expression of E‐cadherin; and group III, low percentage of IL‐17A+ cells and high expression of E‐cadherin. (A,B) The RFS (A) and OS (B) curves of patients at BCLC stage 0‐A (n = 237). (C,D) The RFS (C) and OS (D) curves of patients at TNM stage I (n = 103).
