Figure 1.
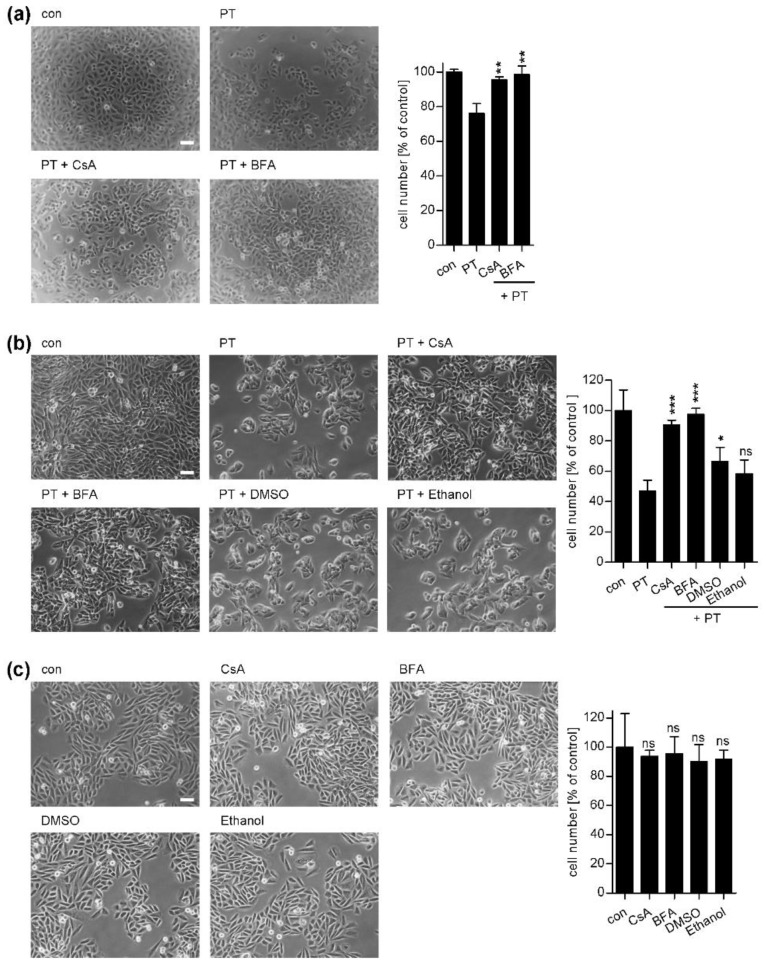
(a) Effect of cyclosporine A (CsA) on intoxication of non-adherent CHO-K1 cells with Bordetella pertussis toxin (PT). CHO-K1 cells were pre-incubated with 10 µM CsA or brefeldin A (BFA) or left untreated for control. After 30 min, the cells were trypsinized and seeded in 96-well plates with culture medium containing 10 ng/mL PT or no toxin for control and incubated at 37 °C and 5% CO2 without inhibitors. After 18 h of incubation, the cells were fixed with PFA and pictures were taken (left panel, white scale bar = 50 µm). Right panel: A quantitative analysis of the total cell number of CHO-K1 cells from an equivalent experiment without PFA treatment is shown. Values are normalized on control cells (n = 3 (3 independent wells per treatment, one picture per well), mean ± SD). (b) Effect of CsA on the intoxication of adherent CHO-K1 cells with PT. CHO-K1 cells were pre-incubated with 10 µM CsA or BFA or left untreated for control. For further control, cells were incubated with DMSO or ethanol, the solvent of BFA and CsA, respectively. The final concentration of DMSO in the medium was 2-fold higher compared to the DMSO concentration used in all inhibitor experiments. After 30 min 10 ng/mL PT were added. 1 h later the culture medium was removed and the cells were further incubated at 37 °C and 5% CO2 in fresh medium without PT and inhibitors. Pictures were taken after 18 h (left panel, white scale bar = 50 µm). Right panel: A quantitative analysis of the total cell number of CHO-K1 cells is shown, values are normalized on control cells (n = 3 (3 different pictures from each sample were quantified), mean ± SD). (c) Effect of CsA, BFA DMSO or ethanol on CHO-K1 cell numbers. Cells were incubated with 10 µM CsA or BFA, DMSO (amount corresponding to the 2-fold maximum amount used for inhibitor incubation) or ethanol for 1 h 45 min. Medium was removed and fresh medium without inhibitors was added for 18 h. Pictures were taken (left panel, white scale bar = 50 µm) and cell numbers determined as described above (right panel). Significance was tested by using the Student’s t test and values refer to samples treated with toxin only (a,b) or to control samples (c) (ns = not significant, * p < 0.05, ** p < 0.01, *** p < 0.001).

