Figure 2.
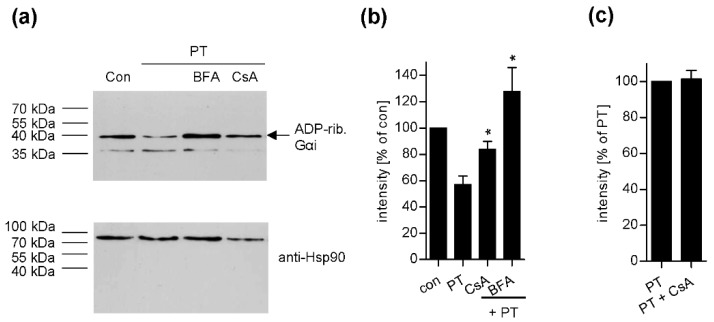
Effect of CsA on the ADP-ribosylation status of Giα in PT-treated CHO-K1 cells. (a) Cells were pre-incubated with 20 µM of CsA or 20 µM BFA for control for 30 min. For further control, cells were left untreated. Then, cells were challenged with 20 ng/mL PT for 3 h in the presence or absence of the respective inhibitors. Cells were lysed and the ADP-ribosylation status of Giα from these cells was analysed by incubation with 170 ng PTS1 in the presence of 10 µM biotin-labelled NAD+. Biotin-labelled (i.e., ADP-ribosylated) Giα was detected with streptavidin-peroxidase. Comparable protein loading was confirmed by Ponceau-S-staining (not shown) and Hsp90 detection by Western blotting. (b) Intensity of signals for biotinylated Giα detected by Western blotting were quantified by densitometry. Values show the percentage of signal intensity referring to untreated cells (Con) and are normalized on the respective loading control obtained by Ponceau S staining. Values are given as mean ± SEM (n = 4 independent experiments). Significance was tested by using the Student’s t test and values refer to samples treated with toxin only (* p < 0.05). (c) CsA does not affect binding of PT to cells. CHO-K1 cells were pre-incubated with 20 µM CsA for 30 min or left untreated for control. Subsequently, cells were incubated on ice with 500 ng/mL PT for 40 min and then washed twice with PBS. Samples were subjected to SDS-PAGE followed by Western Blotting. PTS1 was detected by a specific monoclonal antibody using the ECL system. Signals were quantified by densitometry and are given as percent of the sample treated with PT only. Values are given as mean ± SD (n = 3 values from 2 independent experiments).

