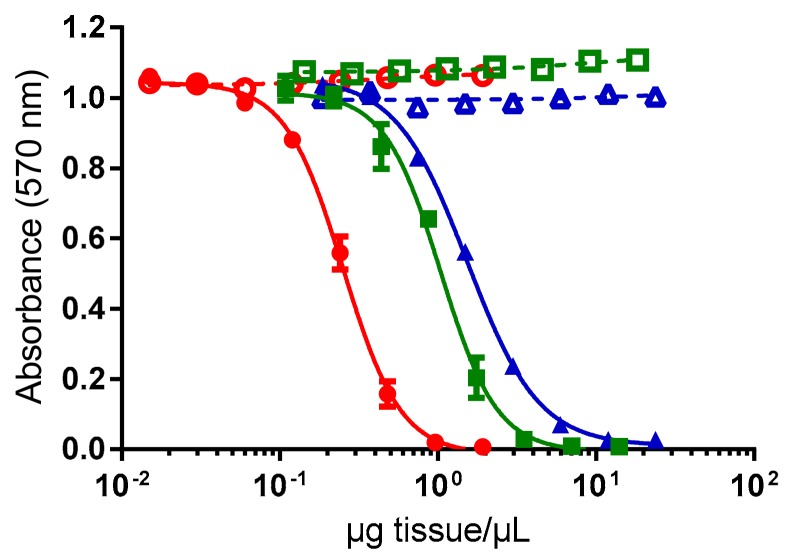
Figure 1.
Dose-response curves of Neuro-2a cells in absence (open symbols) and presence (solid symbols) of ouabain and veratridine (OV− and OV+ conditions, respectively), when exposed to different concentrations of extracts obtained from viscera (○/●), flesh (□/■) and mantle (△/▲) of giant clams exposed to G. polynesiensis cells (TB92 strain). Data represent the mean ± SD of the three experimental tanks, each tissue tested in three independent CBA-N2a experiments (each run in triplicates).

