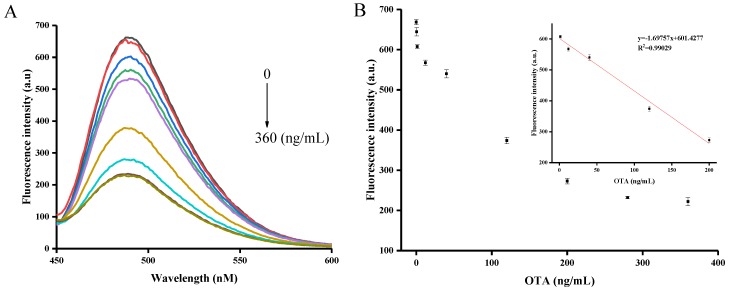
Figure 3.
(A) Fluorescent signal response with different concentrations of OTA. OTA concentration decreased from bottom to top: 360, 280, 200, 120, 40, 12, 1.2, 0.4, and 0 ng/mL, (B) OTA assay showing the linear curve of the enhanced fluorescence intensity to concentration of OTA. The inset shows the linearity of the fluorescence intensity respect to OTA concentrations. Error bars are standard deviations of three experiments.

