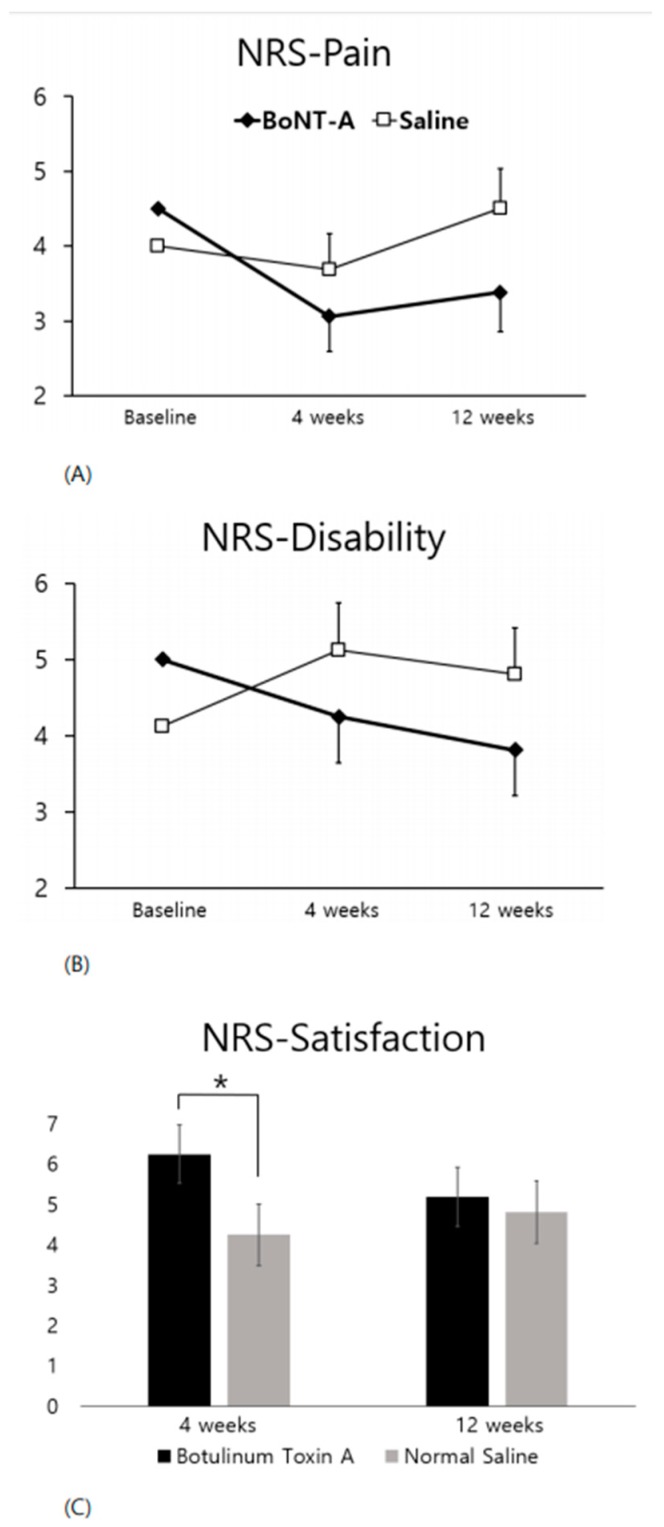
Figure 2.
Comparison of NRS scores between the BoNT-A and the saline injection. Comparison of the NRS score at four weeks and 12 weeks between the BoNT-A and the saline injection, * p < 0.05 for ANCOVA (A,B) and Wilcoxon signed-rank test (C), In Figure 2A,B, the error bar indicates the SE for LS mean change from baseline. In Figure 2C, the error bar indicates the standard deviation. NRS Numeric rating scale, BoNT-A Botulinum toxin A, ANCOVA, Analysis of covariance, SE standard error, LS least-squares.

