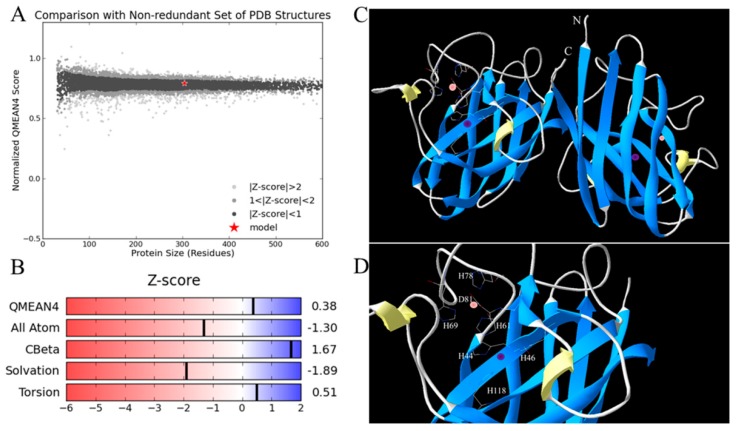
Figure 3.
(A) Comparison of predicted structure with non-redundant set of PDB (Protein Data Bank) structures. The large black dots represent QMEAN Z-score between −1 and 1. The red star represents the model. (B) The four individual terms of the global QMEAN quality scores. (C) Predicted 3D structure of Ps-Cu,Zn-SOD using the Swiss model. Pink and purple spheres represent zinc and copper ions, respectively. The protein is a homodimer. N and C represent the N- and C-terminals of the polypeptide chain. (D) Close-up of the active sites.

